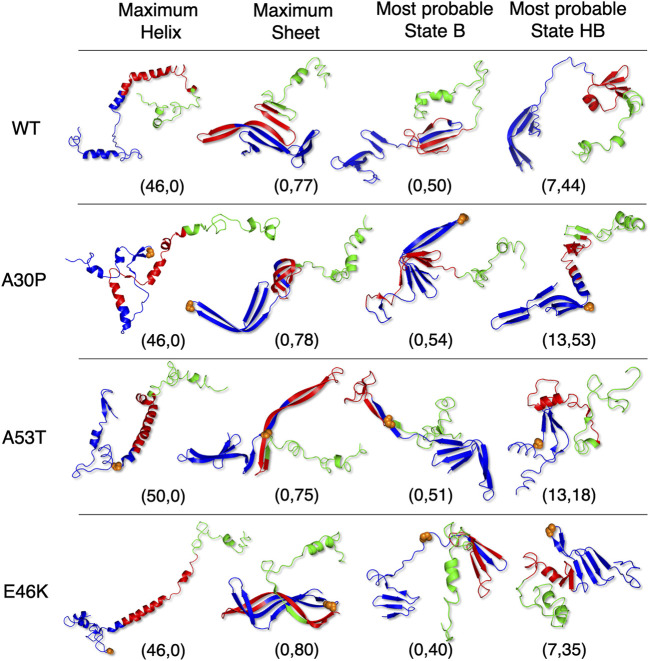
FIGURE 6.
Selected representative structures for WT and mutants extracted from the conformational sub-ensembles corresponding to the maximum fraction in the helix (first column), the maximum fraction in the β-sheet (second column), the most probable sub-state of state B (third column), and the most probable sub-state of state HB (last column). The coordinates correspond to the position in (α, β) maps of Figure 4. Orange spheres represent backbone atoms at the mutation location. The 3D representations were made with the PyMOL software (Schrödinger, 2015).

