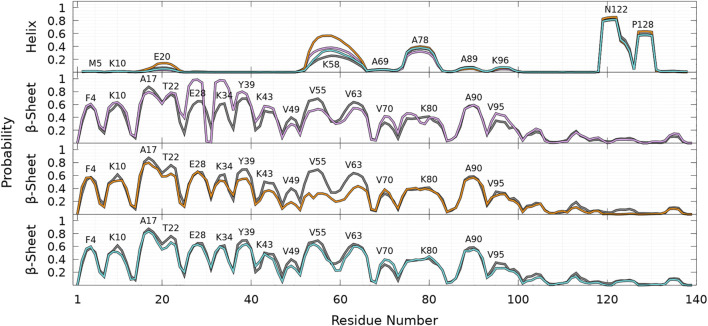
FIGURE 8.
Probability of each residue to pertain to an α-helix (top panel) and a β-sheet (other panels) for WT (gray), A30P (purple), A53T (orange), and E46K (turquoise) as a function of the residue position in the sequence. For the β-sheet, each mutant is compared to WT (gray) with labels pointing out residues at local maxima of the WT probability densities.

