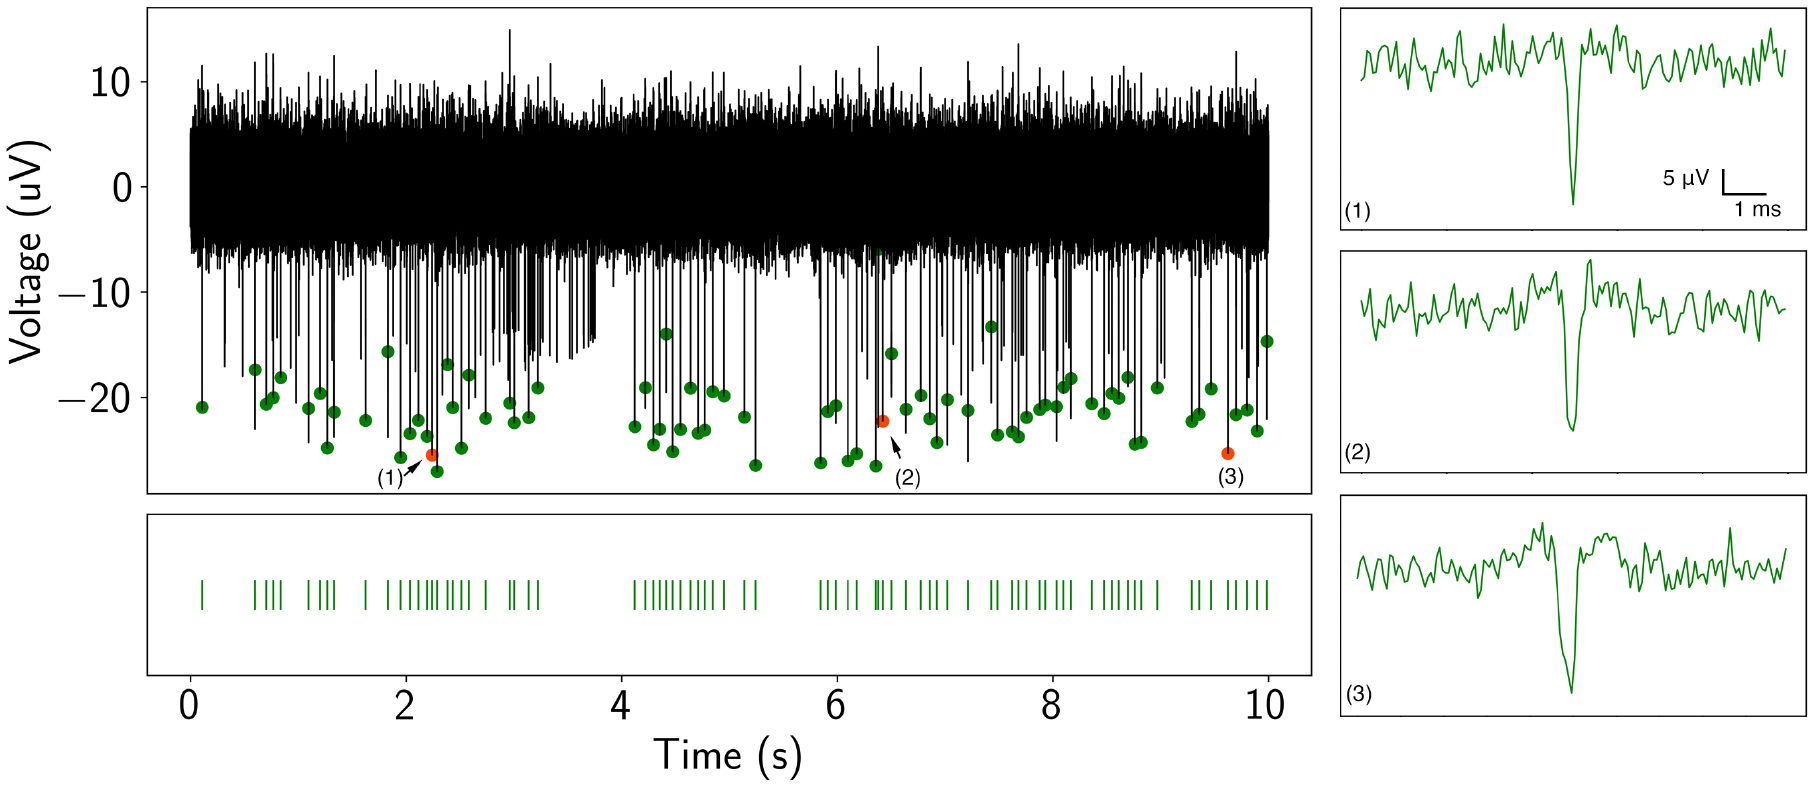
Figure 5. Detection of neuronal spike activity using Piphys.

Spike train (black trace) from a recorded neuron in the time domain from Piphys. Spikes shown here are sorted from SpyKING CIRCUS software and labeled on the raw data with green and orange dots. Bottom: spike raster is aligned with the detected spikes showing firing activities at specific positions. (1)(2)(3) Individual spike examples randomly picked from the spike train. The analysis and quantification of the spike train and waveform are shown in Figure 6.
