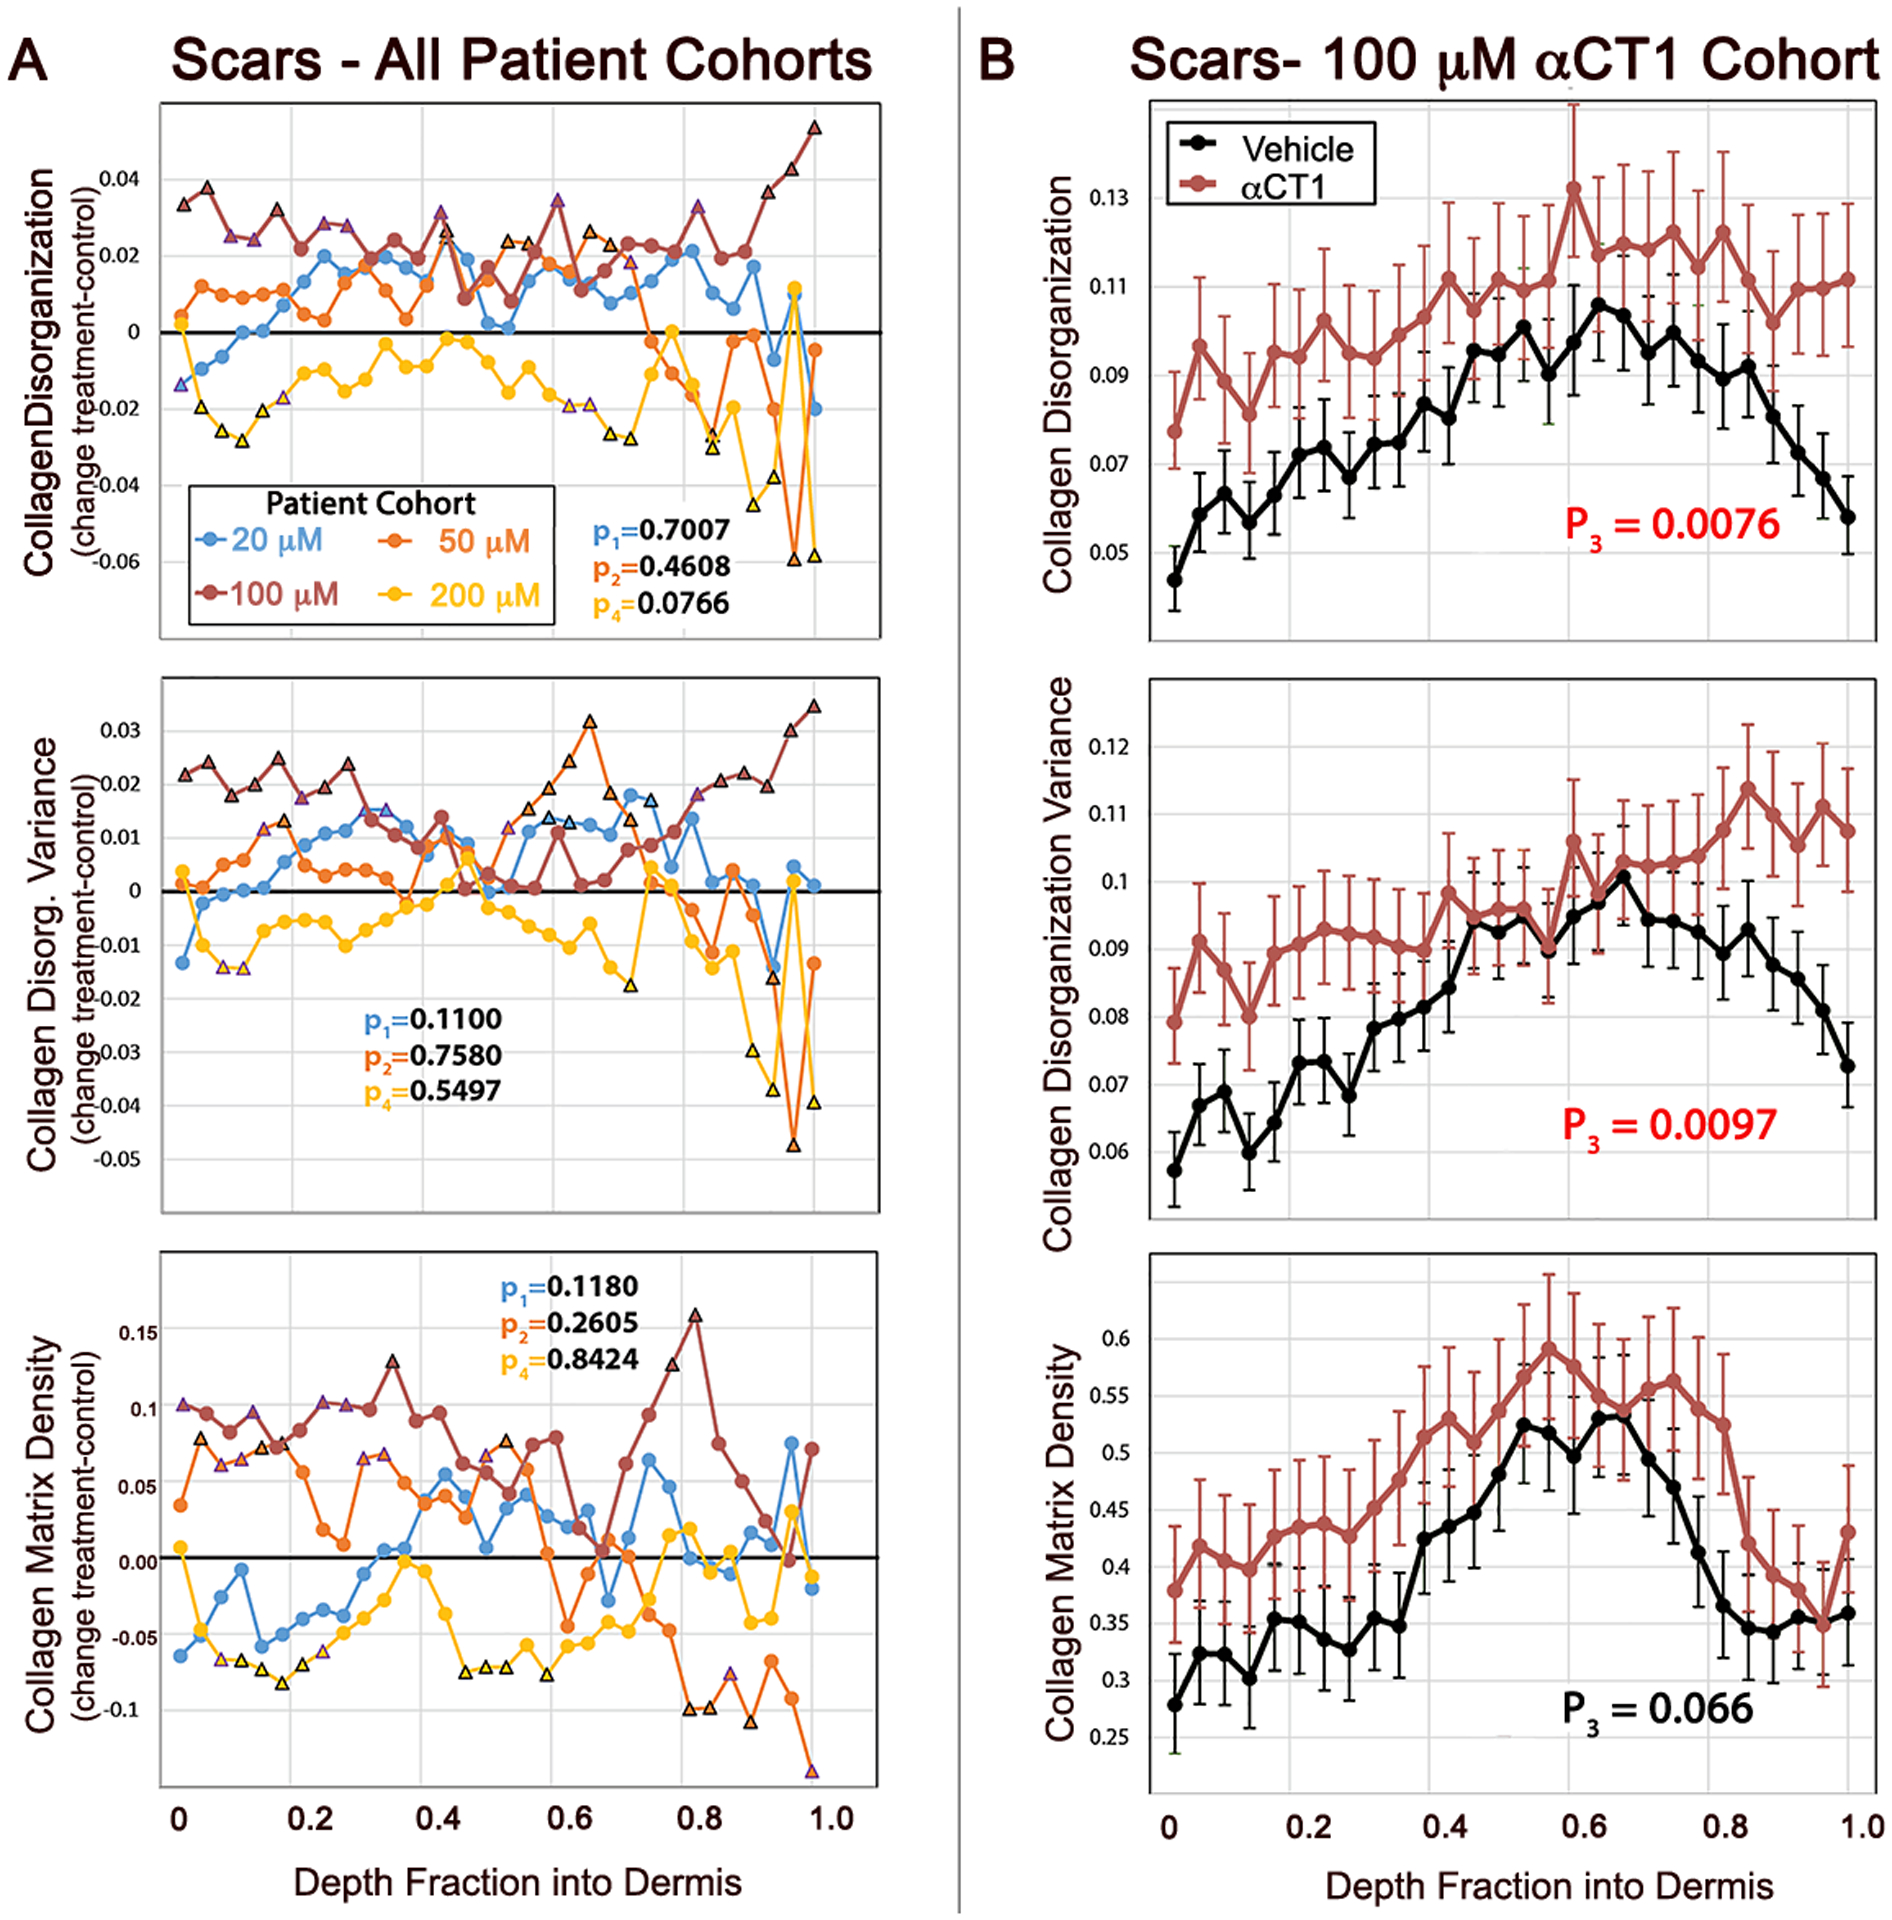
Figure 4. Quantification of αCT1 effects on collagen organization in the human 29-day scar biopsies.

A) Differences between mean αCT1 treatment and vehicle control measurements for collagen bundle density-adjusted circular variance (disorganization), variance in collagen bundle disorganization, and collagen fiber density from the Phase I clinical trial. Plots are shown for each patient dosage cohort from the most superficial part of the dermis (right) to the deepest part of the dermis (left). The measurements were made on images taken at multiple polarization angles. Black triangles on plots indicate a statistically significant difference (p<0.05) between treatment and vehicle at individual fractions of depth into the dermis. Trending points (0.05≤p<0.08) are denoted with a purple triangle. B) Collagen bundle disorganization, disorganization variance, and density by depth into dermis for αCT1-treated (red) and vehicle control (black) scars imaged at multiple polarization angles in the 100 μM patient. Error bars ± standard error (SE). N = 10 patients, 10 μM cohort; 9 patients, 50 μM cohort; 8 patients, 100 μM cohort; and 10 patients, 200 μM cohort. Treatment and control measurements of dermal collagen disorganization and its variance differ significantly in the cohort receiving the therapeutic 100 μM dose of αCT1 - red p values on plots.
