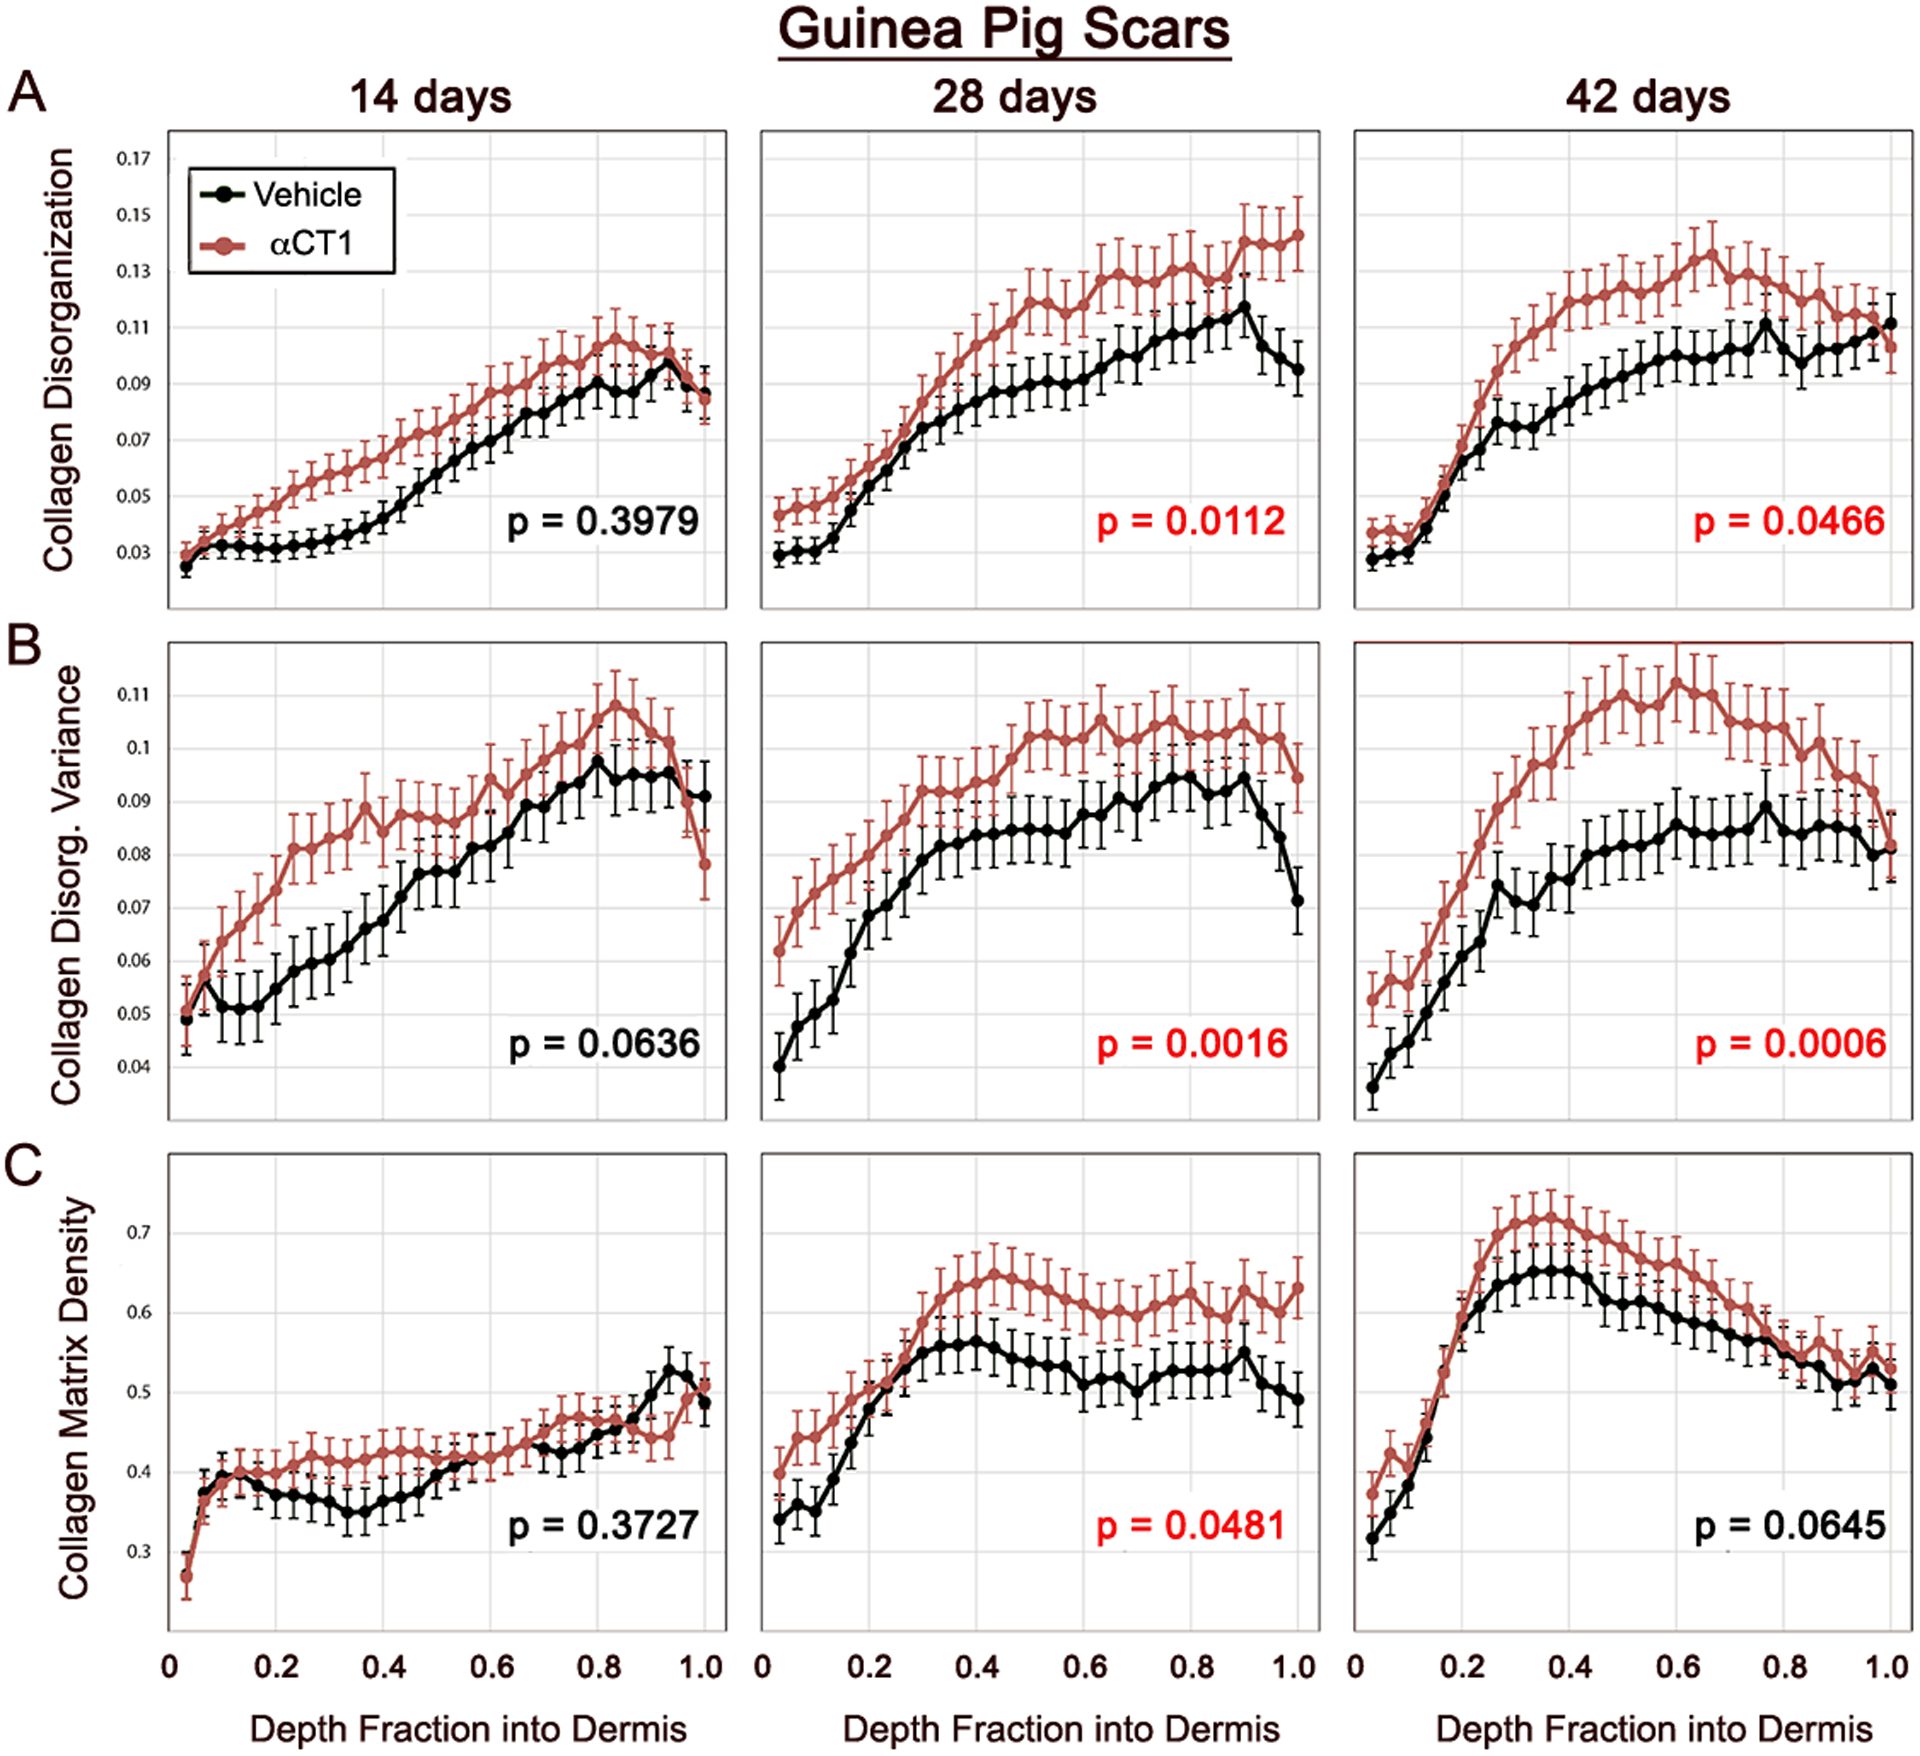
Figure 6. Quantification of time course of αCT1 effects on collagen organization in cutaneous scar biopsies from guinea pig.

Collagen bundle disorganization, disorganization variance, and density by depth into guinea pig dermis for αCT1-treated (red) and vehicle control (black) scars imaged at multiple polarization angles 14, 28 and 42 days following cutaneous wounding and splinting of those injuries. Error bars ± standard error (SE). Red p values on plots indicate significant (p<0.05) overall differences between treatment and control scars. N = 13 guinea pigs × 6 scars/guinea pig.
