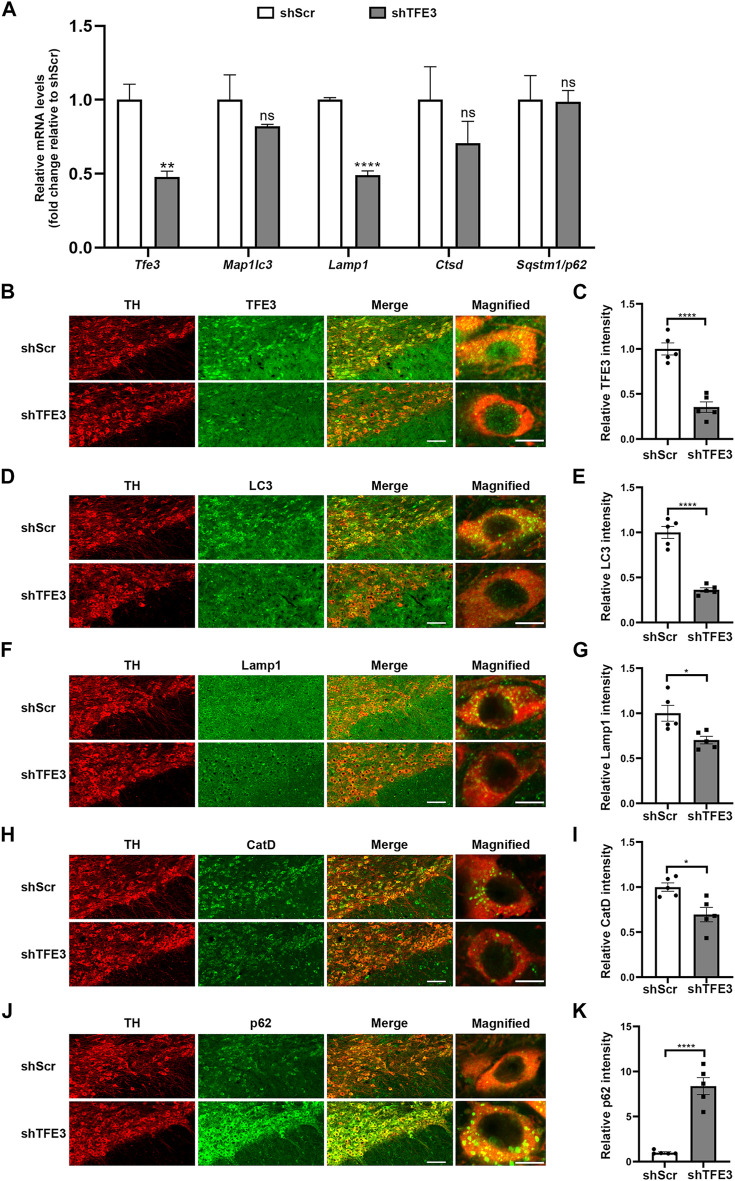
FIGURE 2.
TFE3 knockdown impairs autophagy of dopaminergic neurons. (A) Quantitative RT-PCR analysis of Tfe3, Map1lc3, Lamp1, Ctsd and Sqstm1/p62 mRNA in the SN of mice injected with AAV-shScr or AAV-shTFE3. n = 3 per group. (B, D, F, H and J) Representative images showing immunofluorescence for TFE3 (green, B), LC3 (green, D), Lamp1 (green, F), CatD (green, H) and p62 (green, J) in SN dopaminergic neurons (TH-positive, red) of mice injected with AAV-shScr or AAV-shTFE3. n = 5 per group. Scale bars: low magnification, 100 μm; high magnification, 10 μm. (C, E, G, I and K) Quantitative data are shown. Data are expressed as the mean ± SEM. *p < 0.05, **p < 0.01, ****p < 0.0001, ns, not significant, two-tailed Student’s t test.

