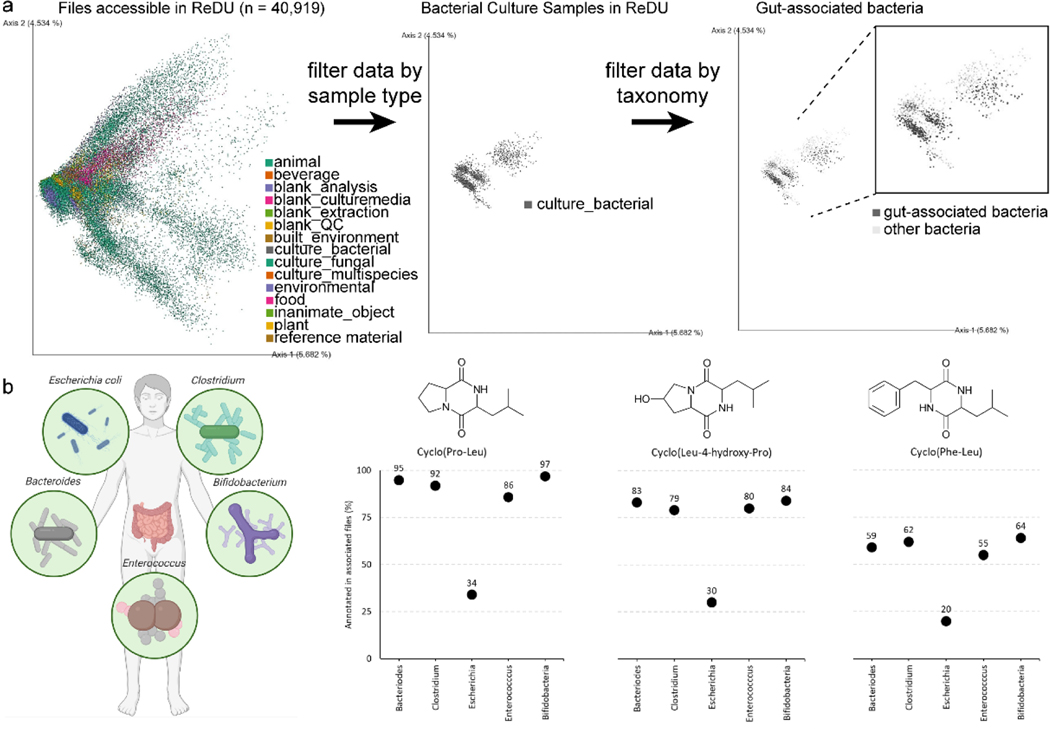
Fig. 3.
(a) Left: Two-dimensional emperor plots displaying the prinicipal component analysis (based on MS/MS data) of files in ReDU (n = 40,919) colored by SampleType. Middle: Highlighting via filtering of bacterial files in ReDU, n = 2,246 files. Right: Highlighting specific bacterial files based on taxonomy in ReDU with gut-associated bacterial in dark grey and all other bacterial files in light grey. (b) Left: Illustration displaying the gut-associated bacterial genera selected for Group Comparator analysis (created with BioRender.com). Right: Dot plots displaying the Group Comparator results (percentage of files in which an annotated spectrum was observed) of three of the most abundant diketopiperazines: cyclo(Pro-Leu), cyclo(Leu-4-hydroxy-Pro) and cyclo(Phe-Leu).

