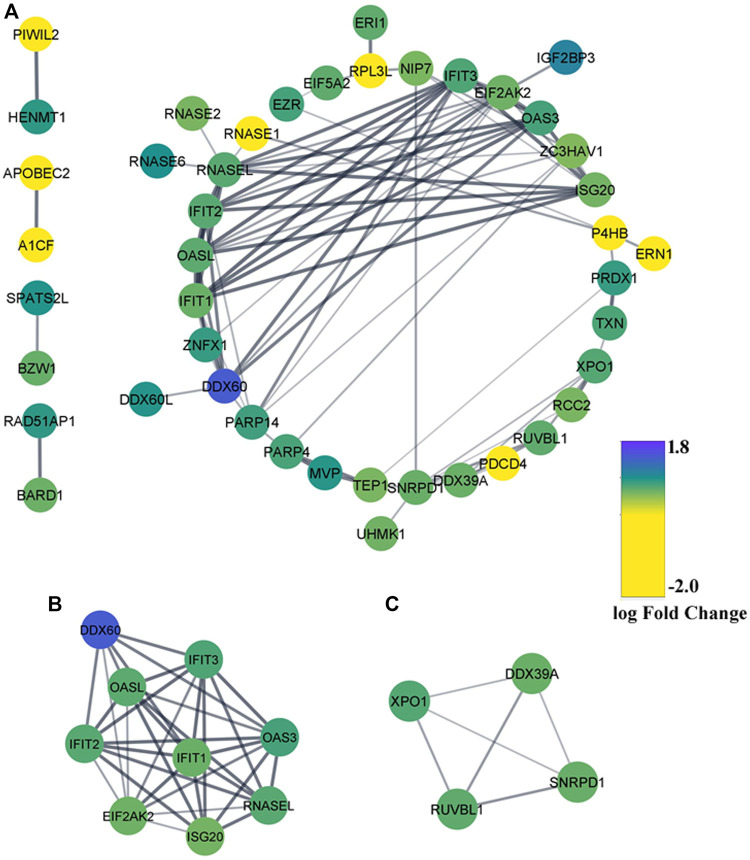
FIGURE 4.
Protein–protein interaction (PPI) network of the differentially expressed RBPs. (A) PPI network of DE-RBPs constructed using the STRING database. RBPs without any interaction with another DE-RBP are removed. Blue denotes upregulated DE-RBPs and yellow denotes downregulated DE-RBPs. (B,C) Two MCODE modules from the PPI network.

