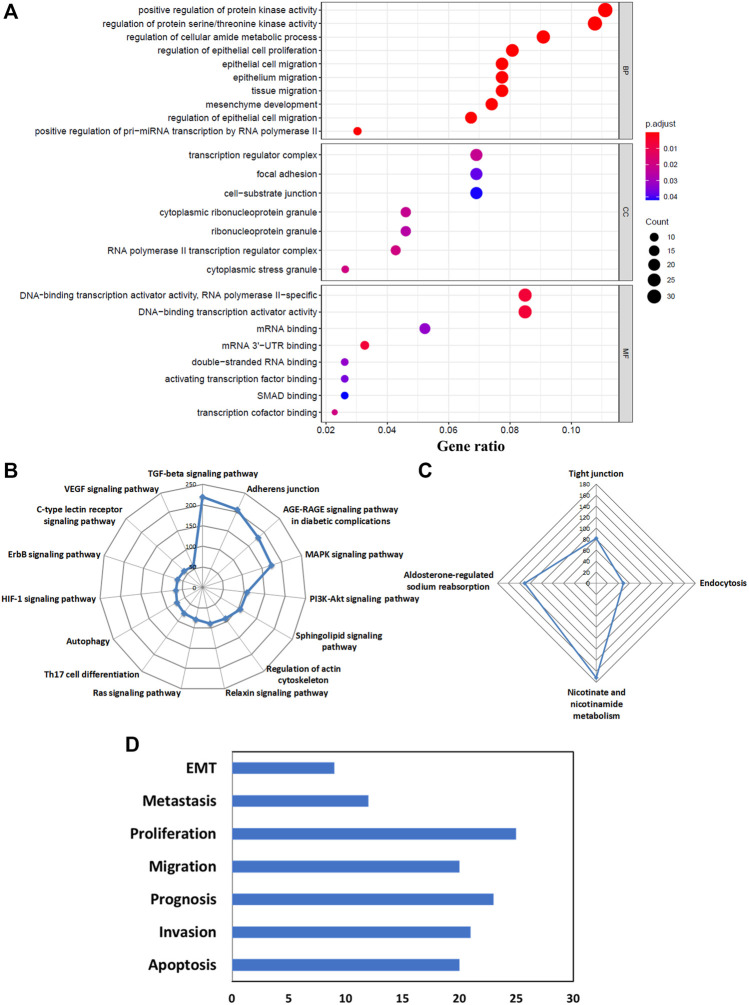
FIGURE 5.
Biological functions and pathways of the predicted target RNAs of DE-RBPs. (A) Bubble plot shows the enriched GO terms of upregulated coding targets: biological processes (BP), Cellular Component (CC), and molecular functions (MF). (B) Radar plot shows KEGG pathway analysis of upregulated coding targets. (C) Radar plot is shows KEGG pathway analysis of downregulated coding targets. (D) Altered pathways represent cancer hallmarks for predicted lncRNA targets from the LncSEA database.

