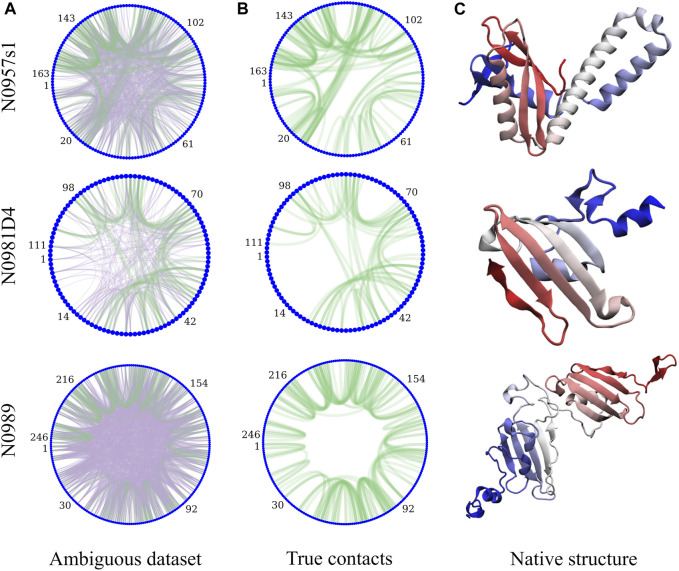
FIGURE 1.
Protein topology determines the heterogeneity in the NMR datasets and their information content. The circle plots are a graph representation of the protein sequence, with each residue being a blue node. Lines represent contacts present in the dataset due to ambiguity (A). Purple lines represent incorrect assignments of the peaks and green are the correct assignments. (B) shows only the correct assignments for clarity. (C) shows the experimental structures (N-termini in blue and C-termini in red).

