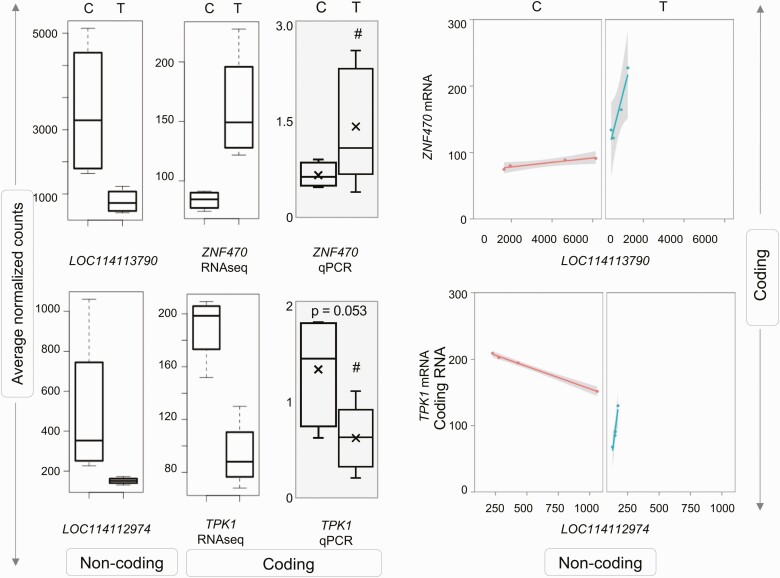
Figure 11.
Correlation of coding and noncoding RNA (ncRNA) expression in muscle from prenatal testosterone (T)-treated animals. Box plots representing the average normalized counts for long noncoding RNA (lncRNA) and messenger RNA (mRNA) pairs that showed significant correlation are shown on the left. The treatment groups—control (C) or prenatal T (T)—are denoted on the x axis and the average normalized counts and fold change vs C on the y axis are denoted by RNA sequencing (RNA-seq) and quantitative polymerase chain reaction (qPCR; gray-shaded box) analyses, respectively. The line plots representing the correlation of expression between the lncRNA-mRNA in treatment group are shown at right. Correlation between lncRNA-mRNA for each pair is represented in orange line for C animals and as a green line for prenatal T-treated animals.

