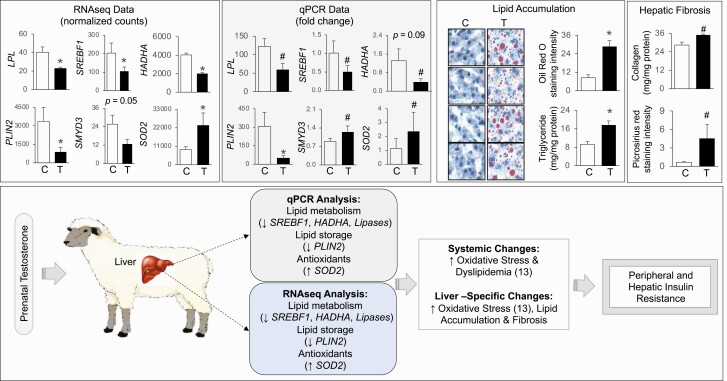
Figure 12.
Validation of RNA sequencing (RNA-seq)-determined differential gene expression in liver from prenatal testosterone (T)-treated sheep. Histograms representing the average fold change for messenger RNA (mRNA) from RNA-seq and quantitative polymerase chain reaction (qPCR) analysis. The treatment groups—control (C) or prenatal T (T)—are denoted on the x axis and the average normalized counts and fold change vs C on the y axis are denoted by RNA-seq and qPCR (gray-shaded box) analyses, respectively, at the top left. Lipid accumulation from oil red O staining and triglyceride assay and collagen deposition by collagen assay and picrosirius red staining from C and T animals are shown at the top right. The data from the larger cohort for some of these genes, lipid accumulation, and collagen deposition were previously published (13, 31, 32). The gene expression changes in prenatal T-treated animals from qPCR and RNA-seq analysis and its link with systemic and hepatic specific changes are summarized (bottom).

