Figure 2.
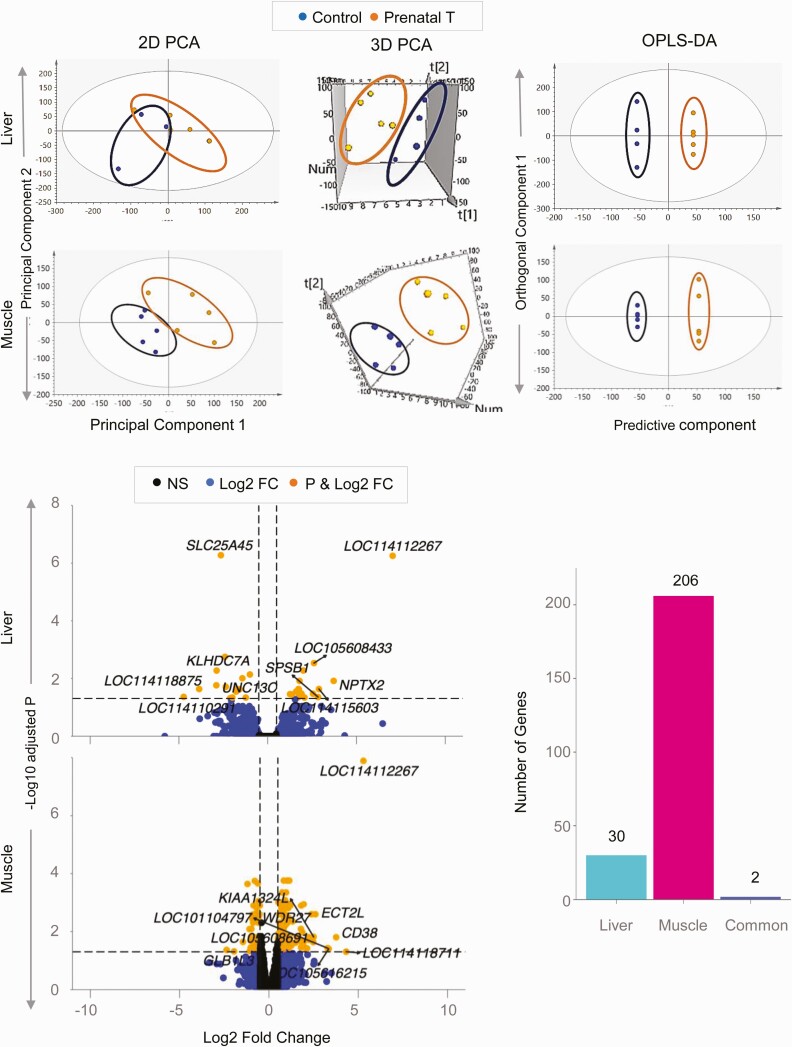
Coding RNA sample clustering and differential expression in liver and muscle from prenatal testosterone (T)-treated animals. The 2-dimensional (2D) and 3-dimensional (3D) principal component analysis (PCA) and orthogonal partial least square discriminant analysis (OPLS-DA) score plots showing groupings and separation between control (blue) and prenatal T-treated (orange) groups in the coding RNA from liver and muscle tissue are shown at the top. For the PCA the 2D and 3D plots are plotted with principal component 1 on the x axis and principal component 2 on the y axis, and for the OPLS-DA score plot with predictive component on the x axis and first orthogonal component on the y axis with each point representing one animal. The volcano plot showing differential gene expression in the liver or muscle comparing prenatal T-treated animals against control animals are shown at the bottom left. Genes are plotted by log2 fold change on the x axis and –log10 P adjusted values on the y axis. Orange points denote the genes that have an absolute log2 fold change greater than 0.5 and P adjusted values less than .05. Black dots represent genes that did not meet P-adjusted cutoff of less than .05 and absolute log2 fold change greater than .5, and blue dots represent genes that met the absolute log2 fold change greater than 0.5 but did not meet the P-adjusted cutoff of less than .05. The bar plots at the bottom right represent the number of genes differentially modulated that are unique to either liver and muscle or common to both tissues.

