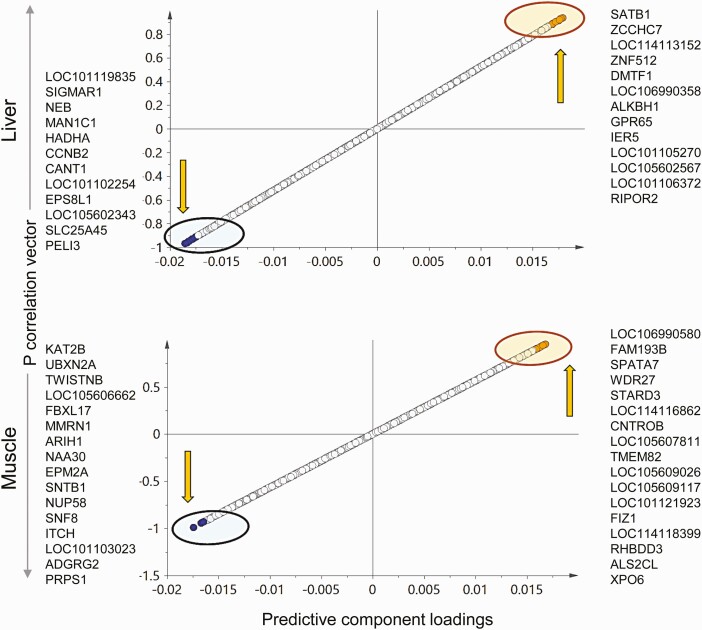
Figure 5.
Liver or muscle specific prenatal testosterone (T)-induced transcriptional signatures. The orthogonal partial least square discriminant analysis (OPLS-DA) plots for coding RNA from liver (top) and muscle (bottom) showing potential biomarkers of prenatal T-treatment. The up and down arrow represents the upregulated and downregulated genes with prenatal T-treatment, respectively. Each point represents one RNA with orange and blue points representing the potential biomarkers of prenatal T-treatment that are upregulated and downregulated, respectively.

