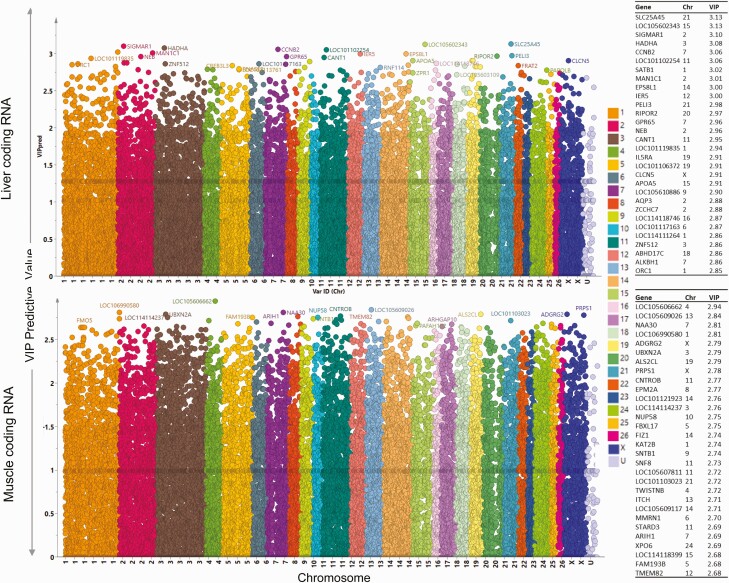
Figure 6.
Variable importance in the projection (VIP) for predictive component plots. Plots showing the VIP for total RNA in liver (top) and muscle (bottom). The plots are plotted with chromosome identification on the x axis (each color representing a chromosome) and VIP values on the y axis. The higher VIP value indicates high importance to the model and is responsible for the separation of prenatal T and control animals on the orthogonal partial least square discriminant analysis (OPLS-DA) score plot. The top 30 genes-based VIP values are listed on the right side of the plots.

