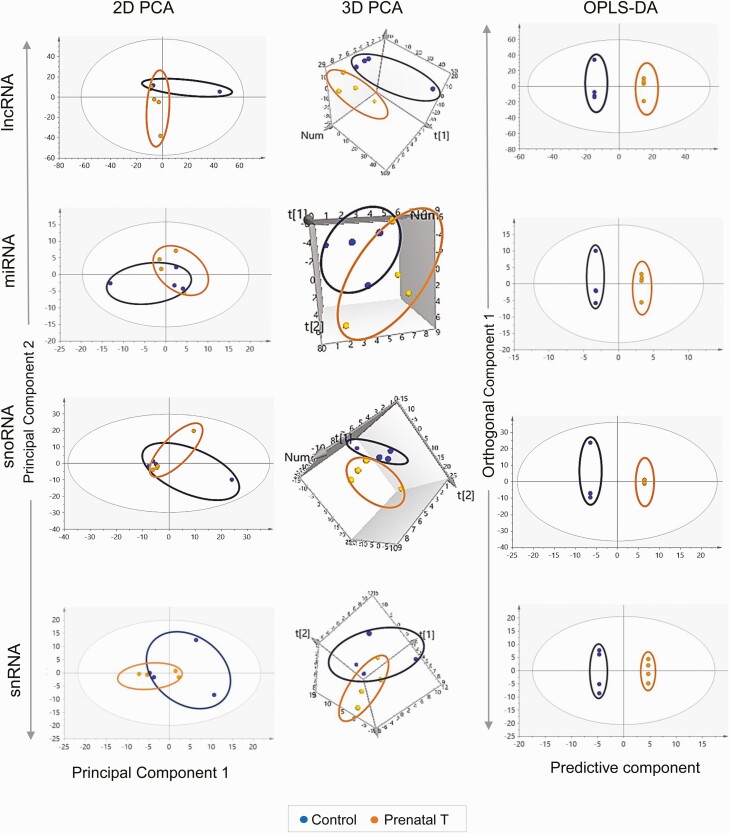
Figure 7.
Clustering and orthogonal partial least square discriminant analysis (OPLS-DA) plots for noncoding RNA in the liver. The 2-dimensional (2D) and 3-dimensional (3D) principal component analysis (PCA) and OPLS-DA score plots for long noncoding RNA (lncRNA), microRNA (miRNA), small nucleolar RNA (snoRNA), and small nuclear RNA (snRNA) in liver from control (blue) and prenatal testosterone (T)-treated (orange) animals. For the PCA the 2D and 3D plots are plotted with principal component 1 on the x axis and principal component 2 on the y axis, and for the OPLS-DA score plot with predictive component on the x axis and first orthogonal component on the y axis with each point representing one animal.

