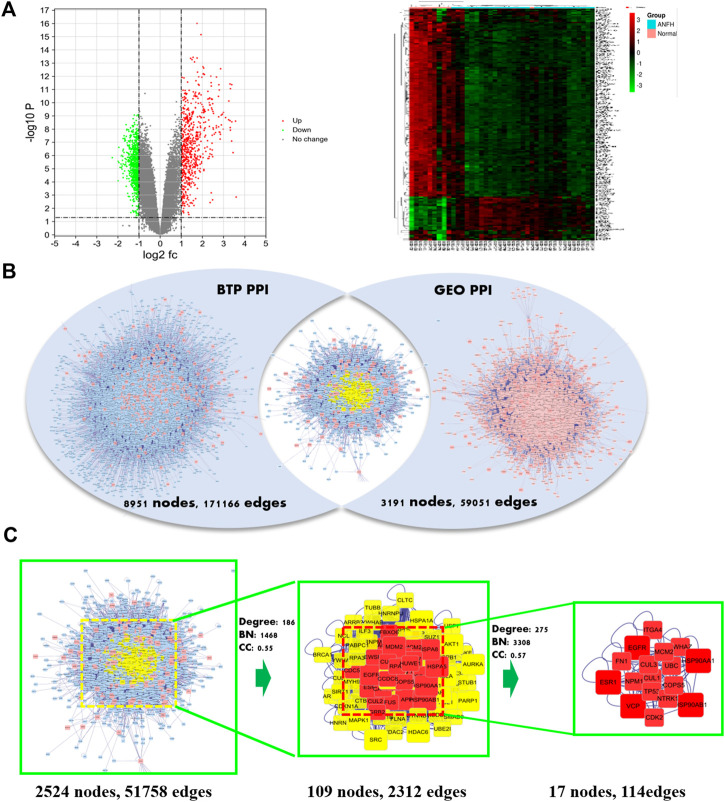
FIGURE 3.
Volcano plot (left) and heatmap (right) of differentially expressed genes (DEGs) in microarray data sets of GSE123568 (A). Intersection PPI network of BTP and DEGs. (B) Identification process of core targets of BTP against ONFH. Nodes for genes and edges for interactions between proteins (C).

