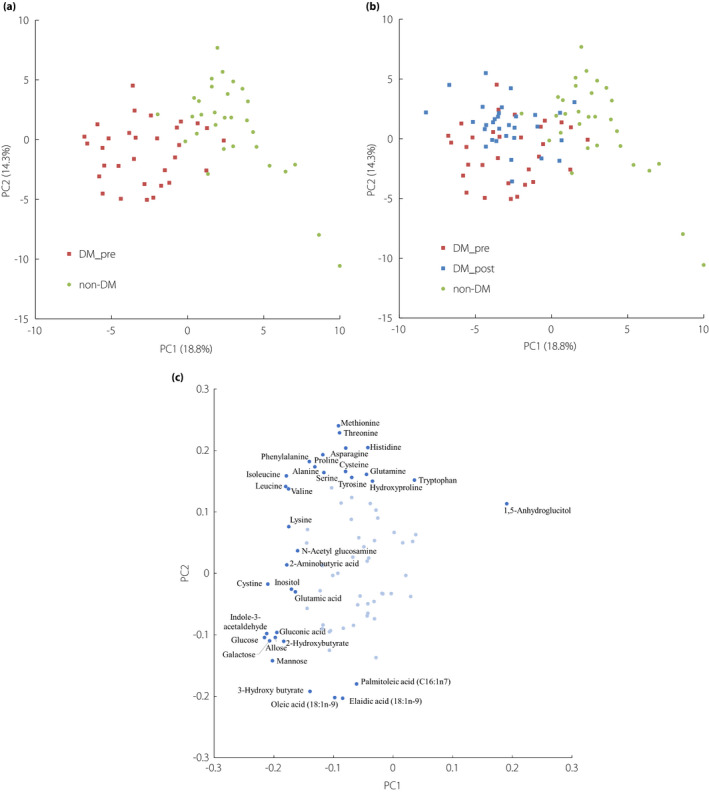
Figure 1.

Principal component analysis score scatter plots (a) with the metabolites of the diabetes group in the pre‐treatment period and non‐diabetes group. (b) The data of the diabetes group in the post‐treatment period were transformed according to the loading score and plotted. (c) The loading plots of principal component analysis (first principal component [PC1] and second principal component [PC2]). Red squares, blue squares and green circles in (a) and (b) indicate the diabetes group in the pre‐treatment period, in the post‐treatment period and the non‐diabetes group, respectively. Proportions of variance are presented in parentheses of each principal component. Dark blue points in (c) represent the metabolites with high absolute value (>0.15) of the loading score of PC1 or PC2. Light blue points represent the other metabolites. The metabolite names only of the dark blue points are described. The loading scores of all metabolites are shown in Tables S2 and S3. DM_post, diabetes group in the post‐treatment period; DM_pre, diabetes group in the pre‐treatment period; non‐DM, non‐diabetes group.
