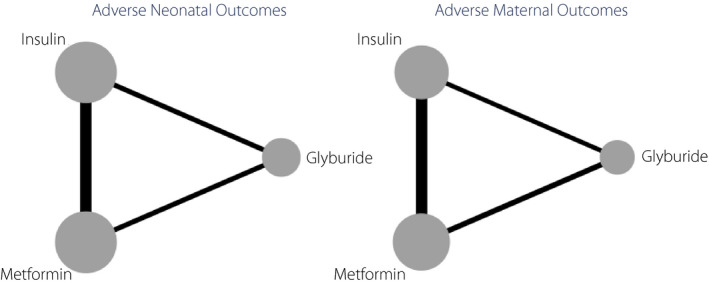
Figure 3.

Map plots of network meta‐analysis of the effects of antidiabetic agents on adverse maternal and neonatal outcomes. The size of the nodes is proportional to the number of studies evaluating each treatment, and the thickness of the edges is proportional to the precision (the inverse of the variance) of each direct comparison.
