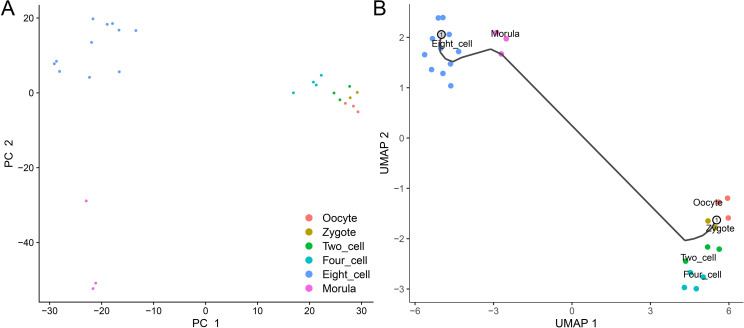
Fig 1. General expression analysis.
(A) Principal Component Analysis (PCA). Samples are separated well with the first two principal components. (B) Single-cell trajectory analysis. Samples are visualized with uniform manifold approximation and projection (UMAP). The line is the pseudo timeline learned by Monocle 3, corresponding to the real human early embryo development.

