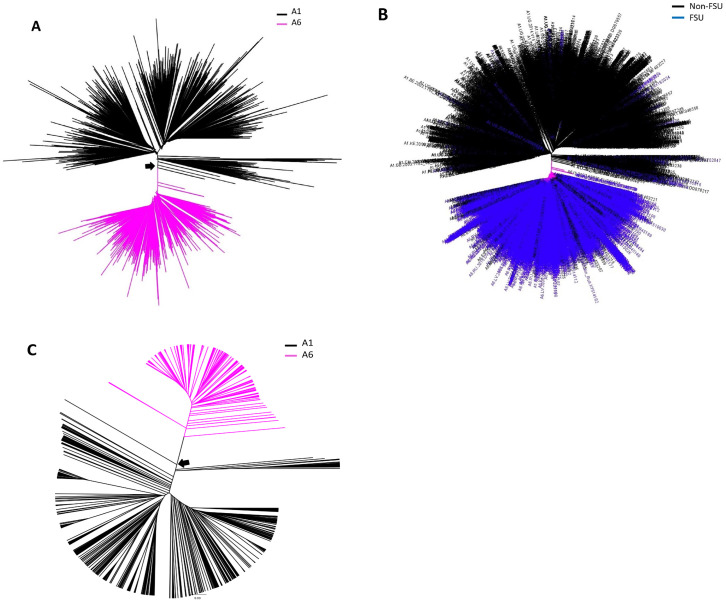
Fig 3. Phylogenetic analysis of HIV subtype A1 and A6 pol and env sequences: Using NJ method, HIV A and B) pol and C) env sequences, representing sub-subtypes A1 and A6, were analyzed.
A) A1 and A6 sequences are shown in black and magenta, respectively. B) pol sequences from FSU and non-FSU countries are shown in blue and black colors, respectively. A and C) Black arrow points to sequences at the node shared (defined as nodes where A1 and A6 sequence(es) converge) between A1 and A6 clusters. Significant nodes had aLRT support value of ≥ 0.85.

