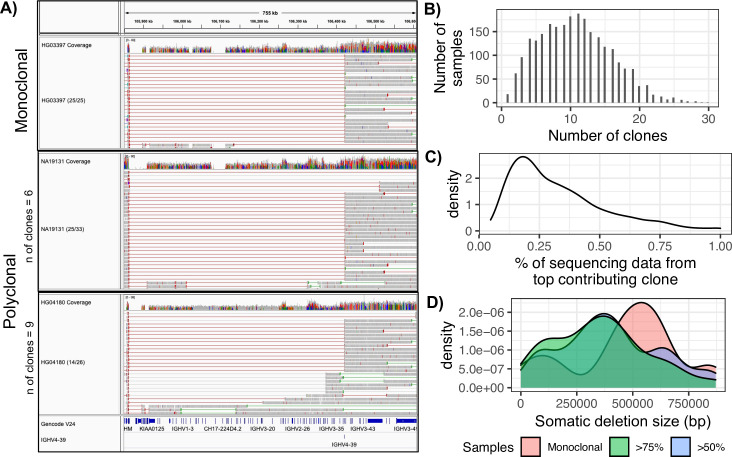
Fig 3. Data signatures of clonality in different samples.
(A) IGV screenshots showing three representative samples with different degrees of clonality, all of which are represented by a dominant clone involving the V(D)J selection of IGHV4-39. Red and gray lines represent long paired read insert lengths. HG03397 has 25 read pairs aligning to IGHV4-39 and are labelled as monoclonal. NA19131 and HG04180, which are defined as polyclonal, have 25/33 and 14/26 read pairs aligning to IGHV4-39. (B) The numbers of samples represented by varying numbers of identified “clones” (unique IGHJ-IGHV pairs). (C) Density plot showing the percentage of sequencing data derived from the dominant clone across all samples. (D) Density plot showing the sizes of somatic deletions associated with the dominant clone across all samples, grouped by whether they are monoclonal or polyclonal; polyclonal samples, specifically, are partitioned into those in which either >50% or >75% of sequencing data was represented by the dominant clone.

