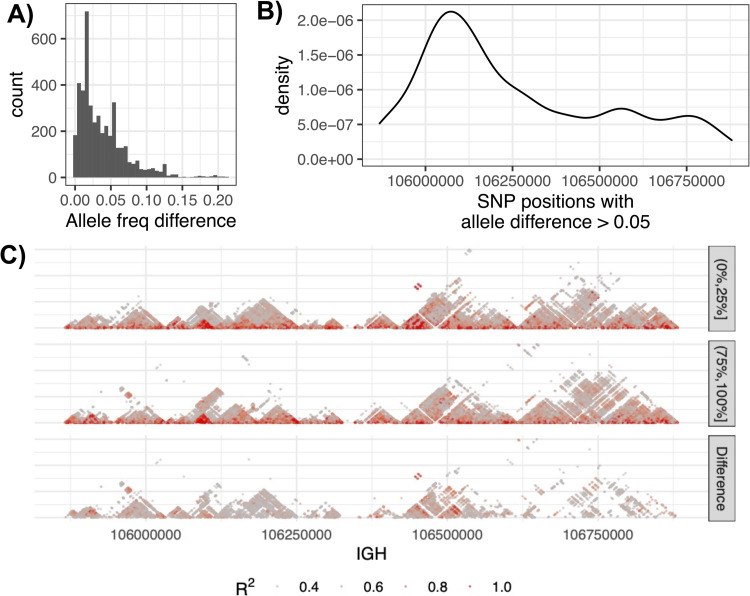
Fig 5. Differences in allele frequency and LD between individuals with low and high clonality.
(A) The distribution of allele frequency differences at common SNPs (MAF >0.05) between individuals with low and high clonality, defined as samples in which 0 to 25% and 75% to 100% of sequencing data was derived from a single clone. (B) Position of common SNPs in IGH with allele frequency differences greater than 0.05. (C) LD for African individuals with low (“(0%,25%]”) and high clonality (“(75%,100%]”), and the difference in LD between both groups.

