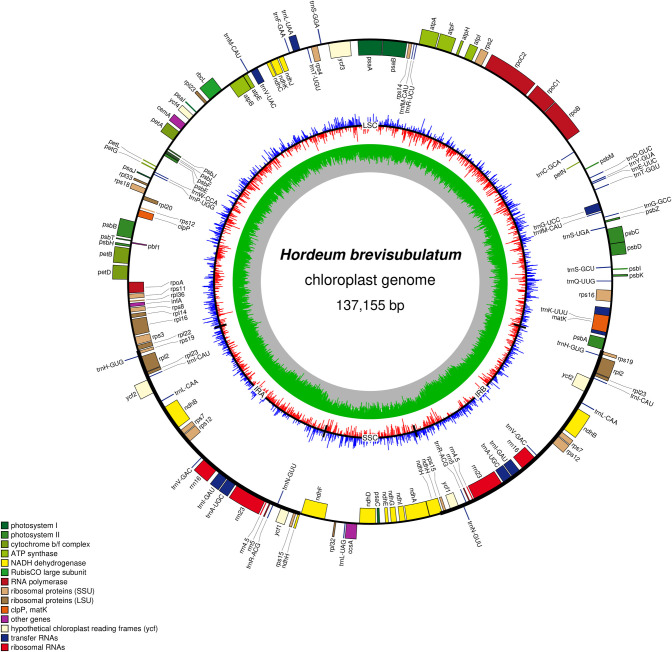
Fig 1. Cp genome map of H. brevisubulatum.
Genes inside the circle are transcribed clockwise, and those outside are transcribed counter-clockwise. Genes of different functions are color-coded. The darker gray in the inner circle shows the GC content, while the lighter gray shows the AT content. The red and blue lines indicate GC skew, the red means GC skew greater than zero while the blue means GC skew smaller than zero.

