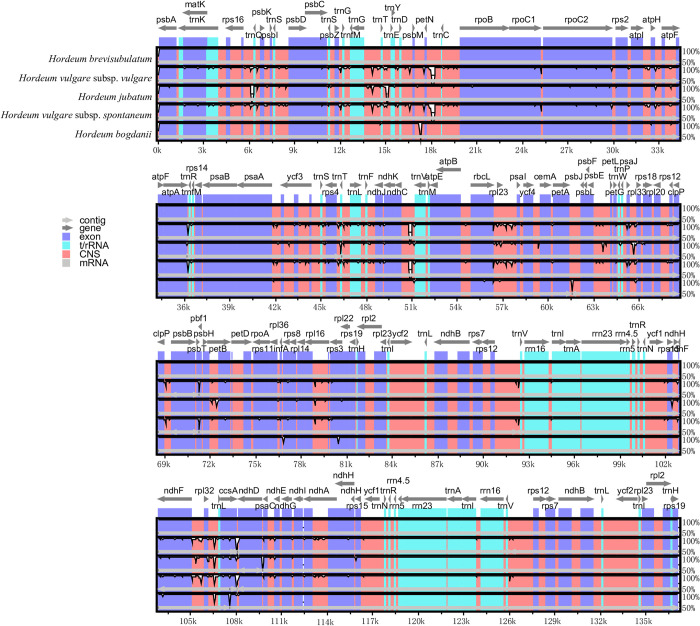
Fig 5. Complete cp genome comparison of five species using the cp genome of H. brevisubulatum as a reference.
The grey arrows and thick black lines above the alignment indicate the gene’s orientations. The Y-axis represents identity ranging from 50% to 100%. UTR, untranslated regions. CNS, conserved non-coding sequences.

