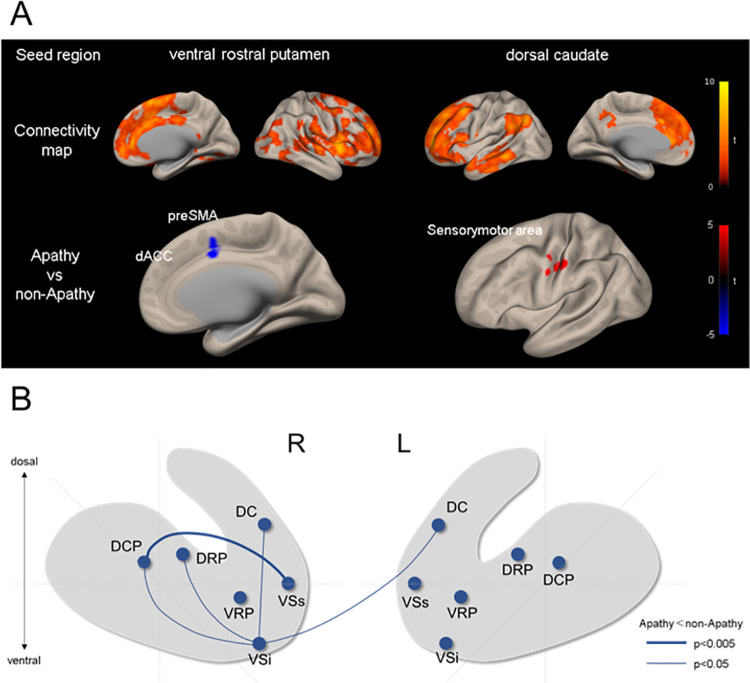
Fig 1. Changes of resting-state functional connectivity associated with apathy.
(A) Seed-tovoxel analysis. The upper row shows whole brain maps of functional connectivity with seeds of the VRP and DC. The lower row shows difference of the functional connectivity between the apathy and non-apathy group for the seeds of VRP and DC. Red and blue foci indicate areas showing significant positive and negative connectivity differences, respectively. (B) Group comparison of ROI-to-ROI analysis for 12 striatal seeds. The blue lines indicate decreased connectivity in the apathy group.

