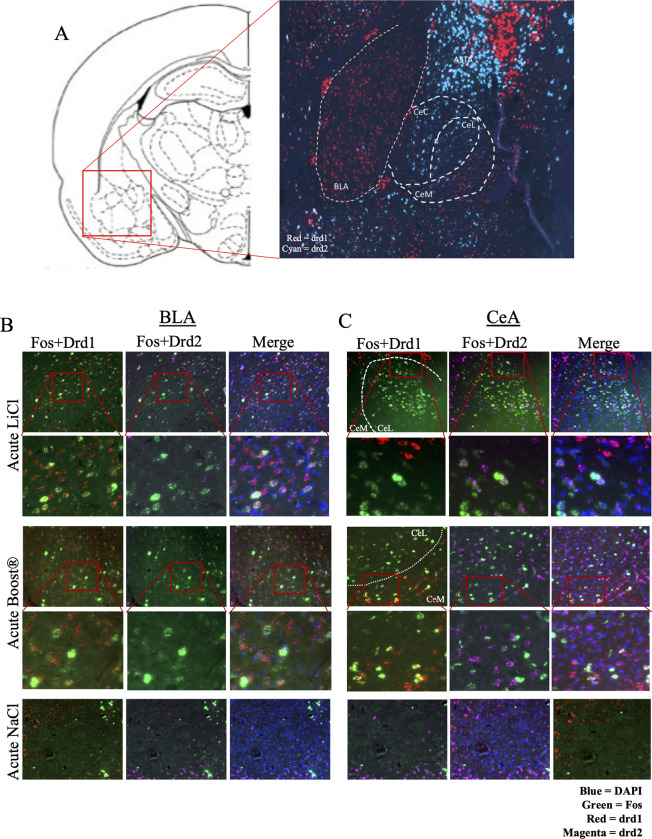
Fig 9.
(A) Distribution of Drd1+ and Drd2+ cells across the amygdala. BLA = basolateral amygdala. CeA = central nucleus of the amygdala. ASTA = amygdalostriatal transition area. (B) Representative images of RNAScope in acute LiCl and acute Boost® ® conditions in the CeA. (C) Representative images of RNAScope in acute LiCl and Boost® conditions in the BLA.

