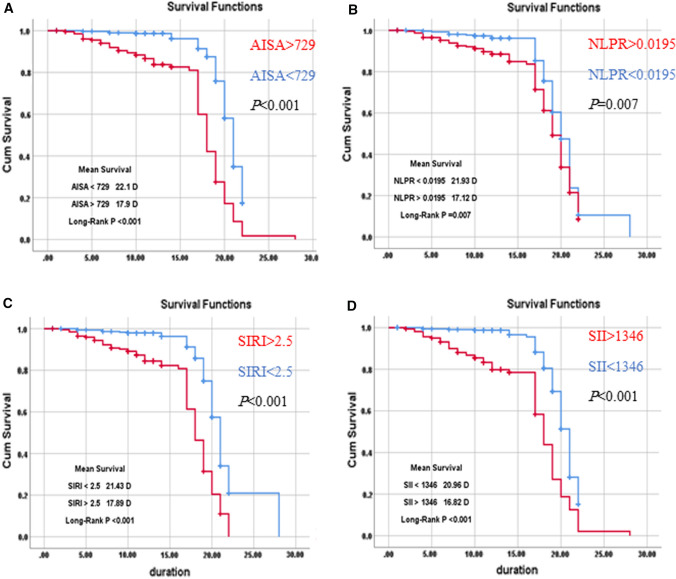
Fig. 3.
Survival analysis using Kaplan–Meier curves according to the studied blood indexes of systemic inflammation: A AISI > 729 vs AISI < 729; P < 0.001, B NLRP > 0.0195 vs. NLRP < 0.0195; P = 0.007 C SIRI > 2,5 vs. SIRI < 2.5; P < 0.001 and (D)SII > 1346 vs. SII < 1346; P < 0.001. AISI, Aggregate Index of Systemic Inflammation; NLPR, neutrophils lymphocyte to platelet ratio; SII, systemic immune-inflammation index; SIRI, systemic inflammation response index

