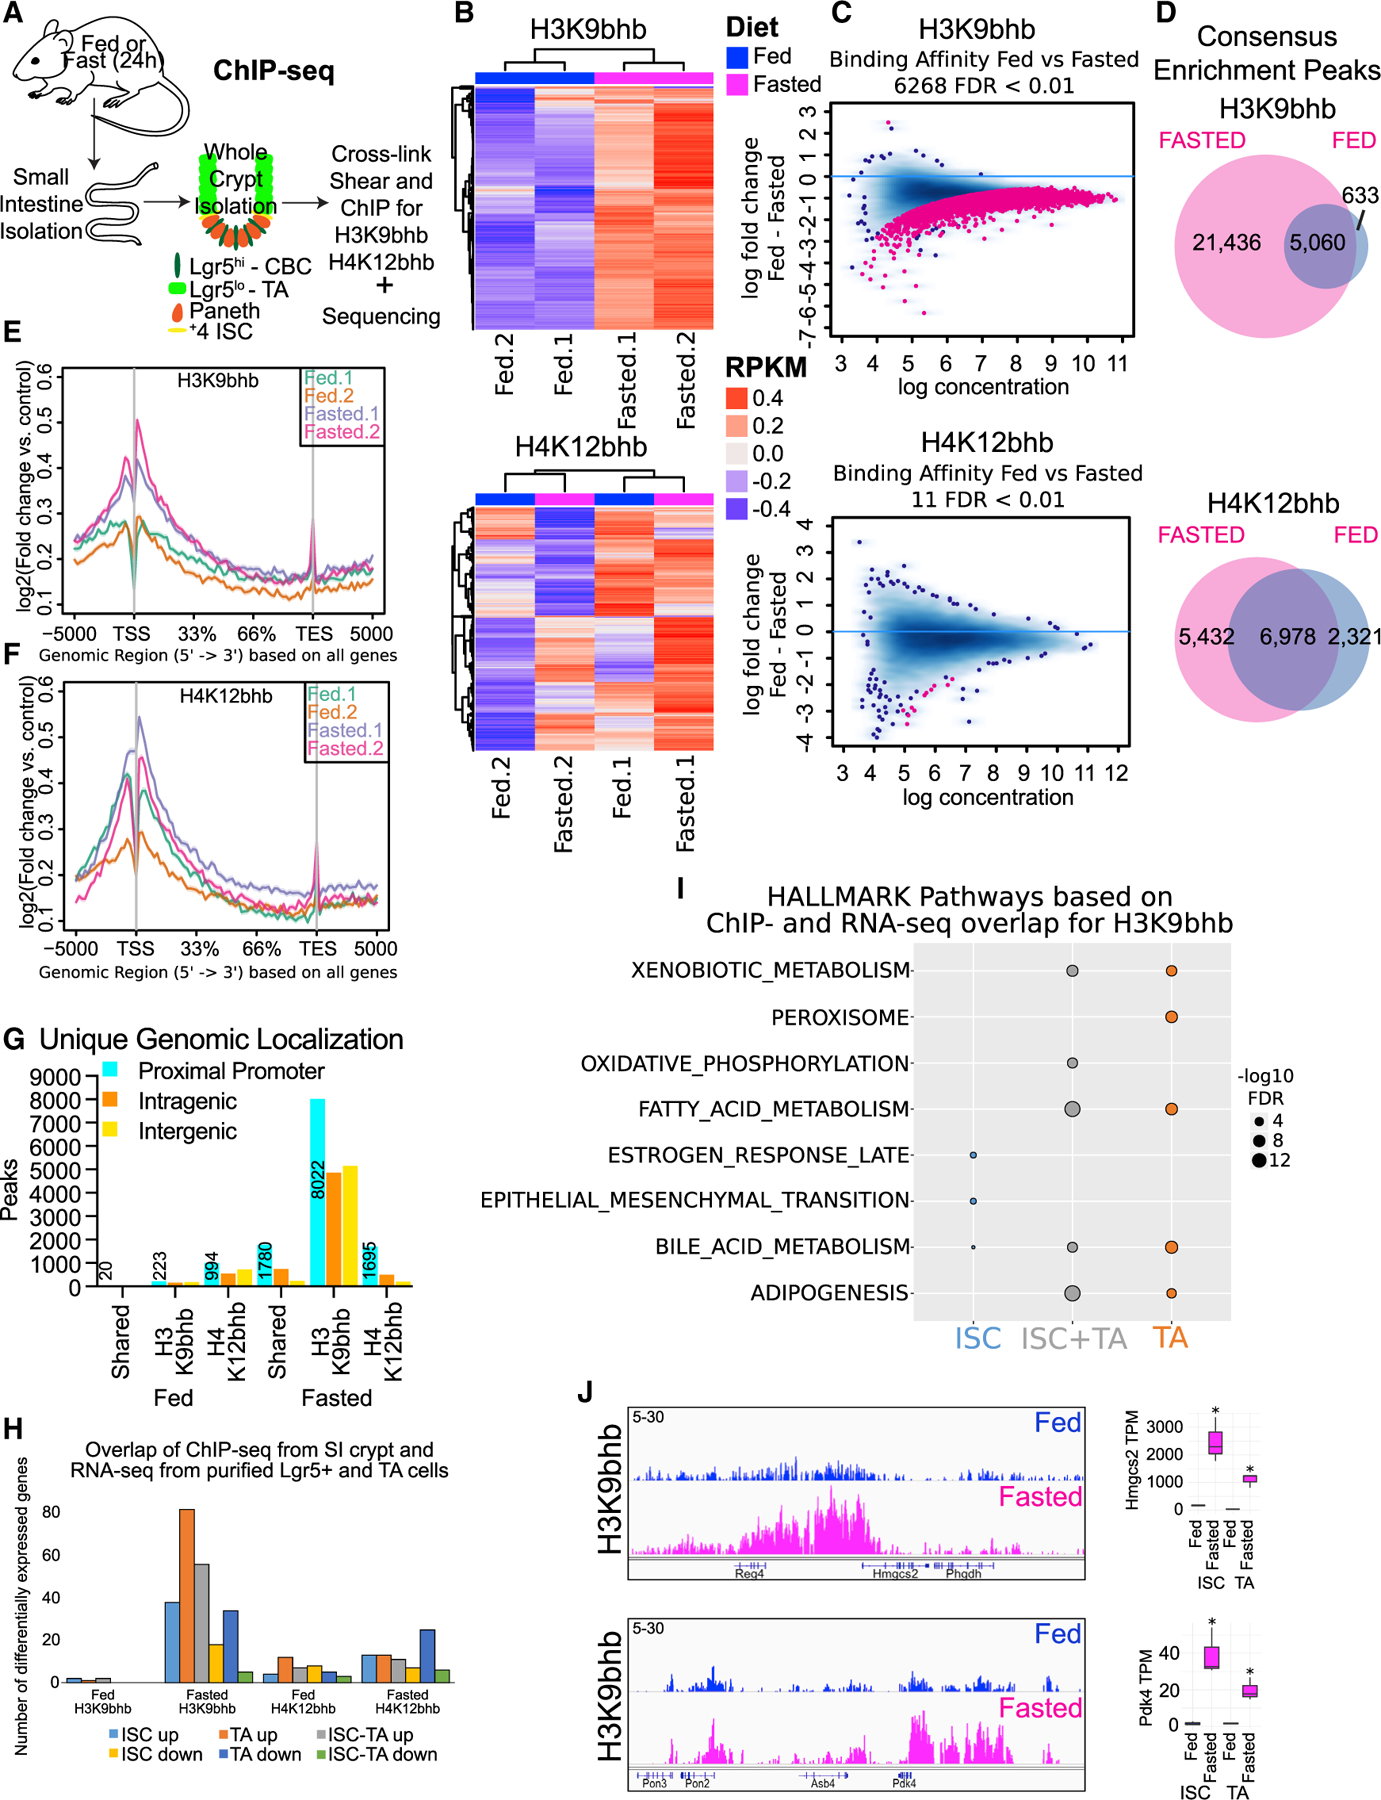
Figure 2. Fasting differentially enriches H3K9bhb at proximal promoters of metabolic programs in small intestine crypts.

(A) Schematic of whole-crypt isolation for ChIP-seq analyses with Kbhb marks.
(B) Unsupervised clustering of the top 5,000 most variable genomic regions for H3K9bhb and H4K12bhb in SI crypt replicates under fed and fasted conditions, based on 2-sample minimal overlap for Model-based analysis of ChIP-seq (MACS) peaks using Diffbind. n = 4 mice per pool per replicate per group. RPKM, reads per kilobase per million mapped reads.
(C) Differential binding affinity for H3K9bhb and H4K12bhb, based on 2-sample minimal overlap for MACS peaks using Diffbind between fed and fasted treatments; FDR < 0.01.
(D) Co-localization analysis of H3K9bhb and H4K12bhb consensus enrichment peaks in fed and fasted SI crypts.
(E and F) Signal intensity gene body plots of H3K9bhb and H4K12bhb in individual replicates. Ensembl genes are arranged 5′ to 3′ from −5 kb to the TSS, TSS, 33%, 66%, transcription end site (TES), and +5 kb from the TES. An arrow denotes the TSS at the 5′ region of the gene.
(G) Genomic distribution for unique H3K9bhb and H4K12bhb. The proximal promoter encompasses ±5 kb of the TSS, and peak numbers of proximal promoters are listed. Intragenic encompasses regions +5 kb to the TES. Intergenic encompasses regions outside of ±5 kb of the TSS to TES.
(H) Barplot displaying H3K9bhb and H4K12bhb proximal promoter peaks from whole SI crypt ChIP-seq overlapping with differentially expressed genes from isolated ISCs and TA cells.
(I) Top 5 MSigDB GSEA pathways based on H3K9bhb or H4K12bhb proximal promoter peaks overlapping differentially expressed genes in ISCs, ISCs and TA cells, and TA cells under the fasted condition. Size of dot represents −log10 FDR value.
(J) Genome browser view of ChIP-seq tracks for H3K9bhb-enriched regions in SI crypts at the fasting-responsive genes Hmgcs2 and Pdk4 under fed and fasted conditions. All tracks are set at 5–30 data range. RNA counts (means with 95% confidence interval [CI]) in ISCs and TA cells of genes within the displayed H3K9bhb regions. TPM, transcripts per million. *q < 3.18e–18.
See also Figure S2.
