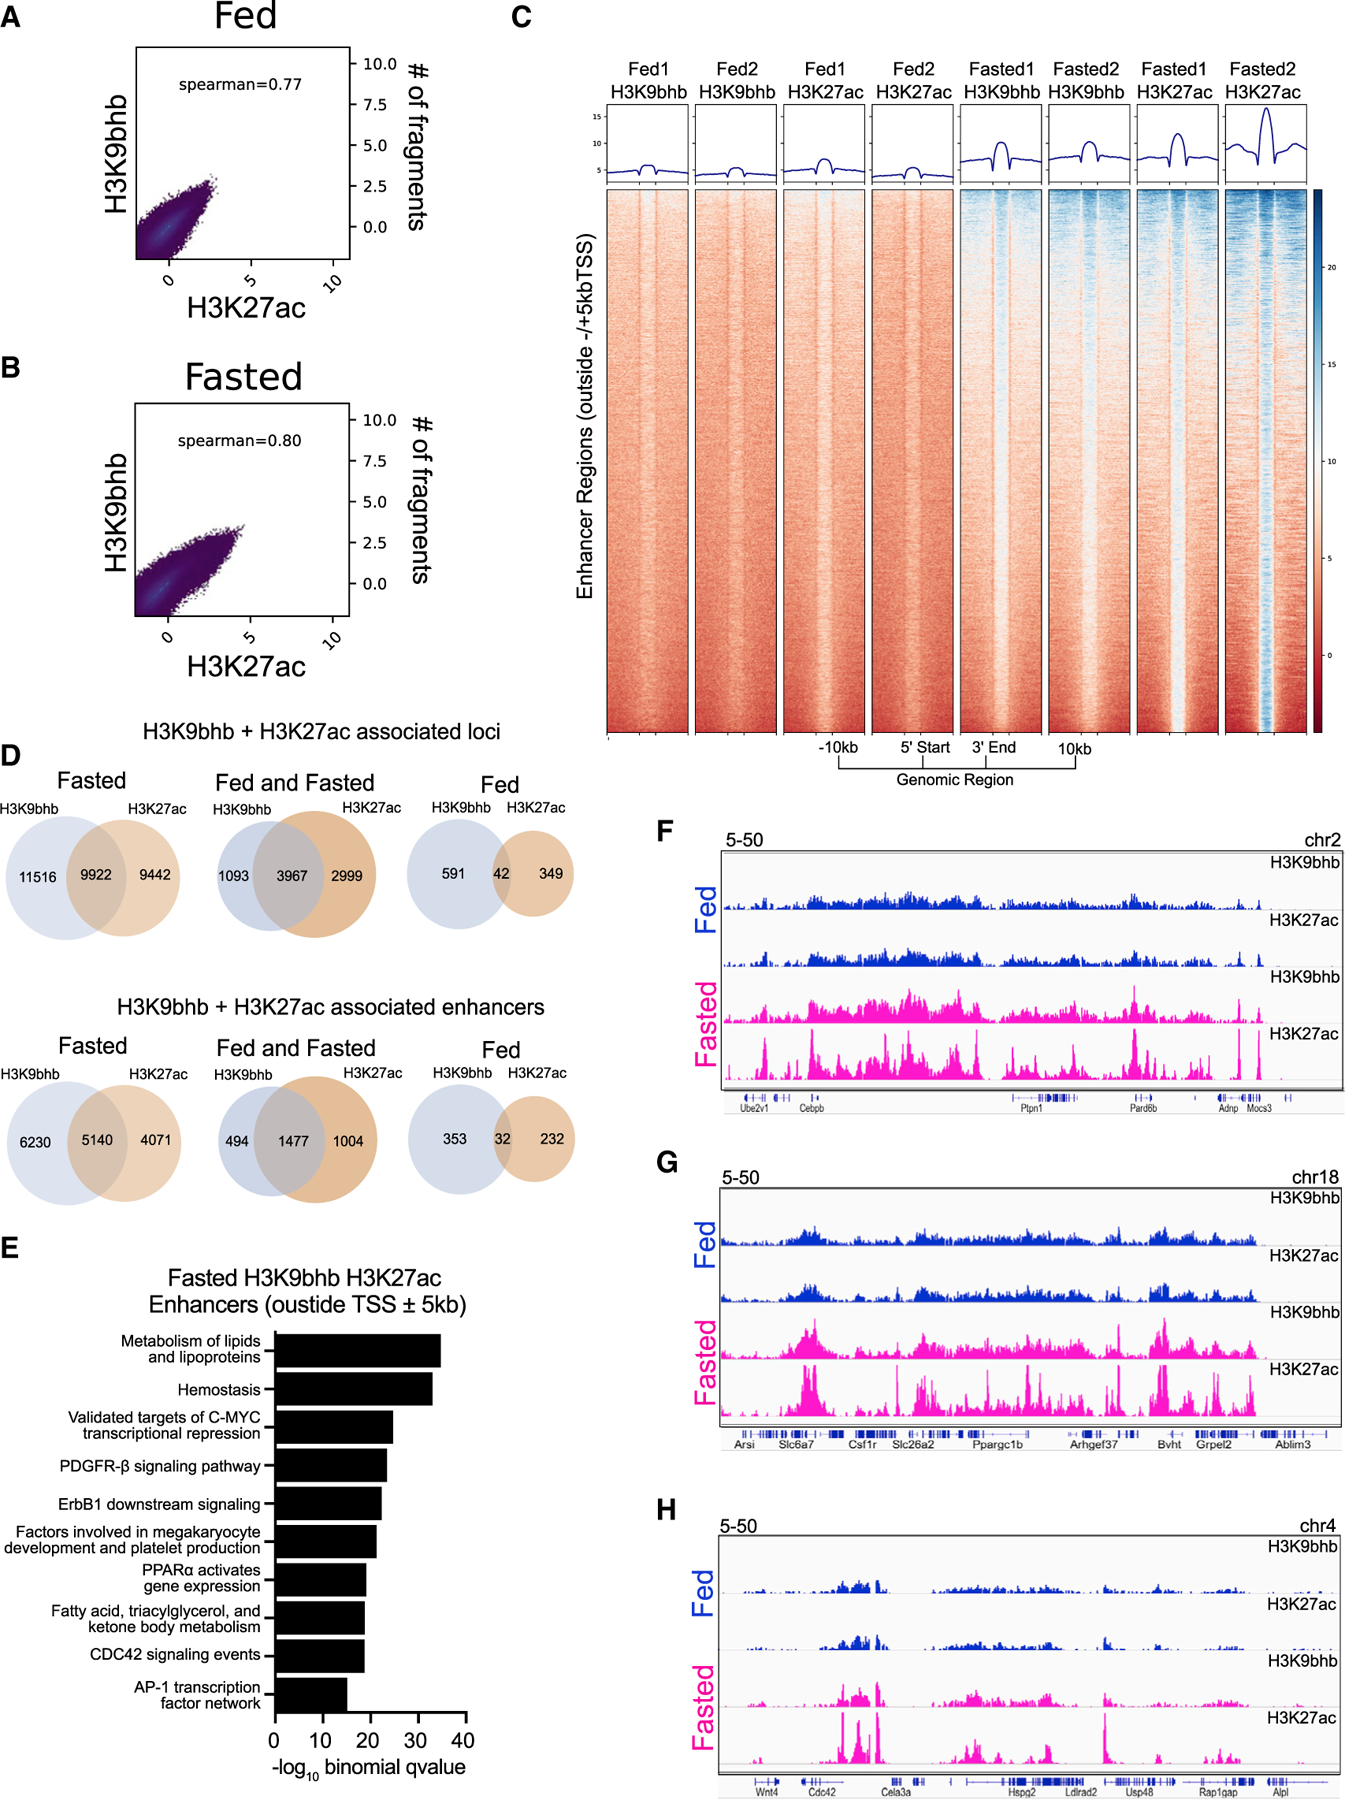
Figure 4. Histone Kbhb is associated with fasting coupled enhancers.

(A and B) Spearman correlation analysis for H3K9bhb and H3K27ac under fed and fasted conditions based on 500-bp genomic bins across the entire genome.
(C) Individual replicate signal intensity plots of H3K9bhb and H3K27ac for enhancer regions (excluding ±5 kb of the TSS) under the fed and fasted conditions. Regions are displayed from −10 kb to the 5′ start and +10 kb from the 3′ end of enhancer peaks.
(D) Co-localization analysis for H3K27ac- and H3K9bhb-associated loci genome wide and within enhancer regions (excluding ±5 kb of the TSS) between fed and fasted crypts.
(E) Top 10 MSigDB pathways enriched by −log10 binomial q value from GREAT annotation predictions of fasting enhancer (excluding ±5 kb of the TSS) cis-regulatory regions.
(F) Genome browser view of ChIP-seq tracks for H3K27ac + H3K9bhb enhancer-enriched regions at the Cebpb and Ptpn1 loci. Fed (blue) and fasted (magenta) tracks are shown, with all tracks set at the indicated data range.
(G) Genome browser view of ChIP-seq tracks for H3K27ac + H3K9bhb enhancer-enriched regions at the Ppargc1b locus. Fed (blue) and fasted (magenta) tracks are shown, with all tracks set at the indicated data range.
(H) Genome browser view of ChIP-seq tracks for H3K27ac + H3K9bhb enhancer-enriched regions at the Cdc42 locus. Fed (blue) and fasted (magenta) tracks are shown, with all tracks set at the indicated data range.
See also Figure S3.
