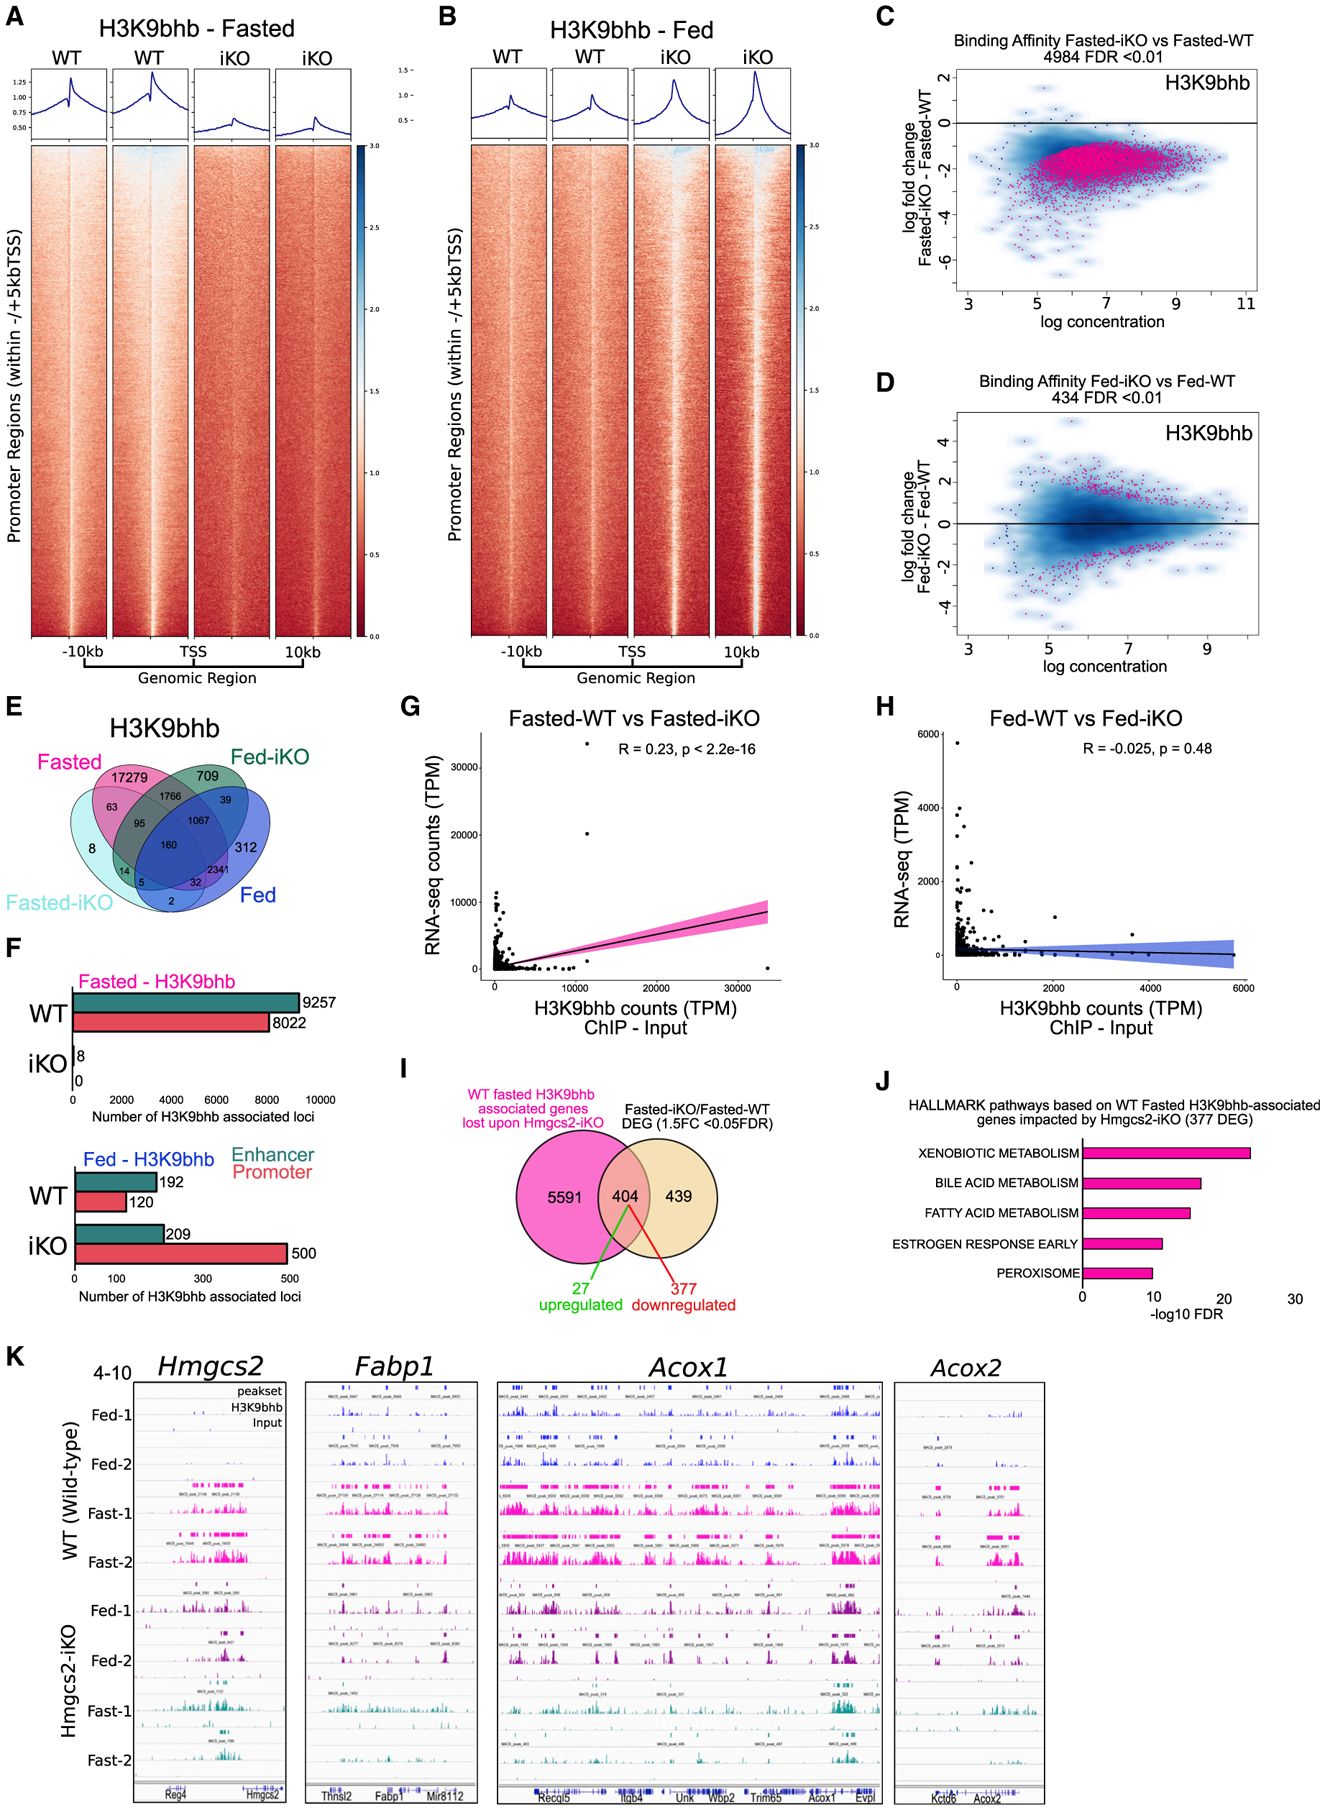
Figure 6. Loss of Hmgcs2 affects H3K9bhb enrichment on fasting-specific genes in the SI.

(A and B) Individual replicate signal intensity plots of H3K9bhb in Ensembl gene promoter regions (within ±5 kb of the TSS) from WT and iKO SI crypt cells under fasted and fed conditions. Ensembl genes are arranged 5′ to 3′ from −10 kb to the TSS and +10 kb from the TES.
(C and D) Differential binding affinity for H3K9bhb, based on 4-sample minimal overlap for MACS peaks using Diffbind between fasted WT and iKO and fed WT and iKO mice. FDR < 0.01.
(E) Co-localization analysis of H3K9bhb consensus peaks from WT and iKO SI crypt cells under fasted and fed conditions.
(F) Genomic distribution of H3K9bhb consensus peaks within promoter and enhancer regions from WT and iKO SI crypt cells under fasted and fed conditions. Proximal promoters encompass ±5 kb of the TSS, and enhancers encompass regions excluding ±5 kb of the TSS.
(G and H) Pearson correlation plots for H3K9bhb and RNA-seq data based on all H3K9bhb-associated promoter regions under the fasted and fed conditions.
(I) Overlaps of H3K9bhb peaks (±5 kb of the TSS) from fasted WT samples in (F) with differentially expressed genes from fasted Hmgcs2-iKO versus WT SI crypts.
(J) Top 5 MSigDB GSEA pathways enriched by −log10 FDR based on fasted H3K9bhb-associated genes significantly affected by loss of Hmgcs2.
(K) Genome browser view of ChIP-seq tracks for the H3K9bhb enriched region at the Hmgcs2, Fabp1, Acox1, and Acox2 loci. Fed (blue) and fasted (magenta) tracks are shown in WT and fed (purple) and fasted (green) in iKO SI crypt cells, with all tracks set at the indicated data range.
See also Figure S6.
