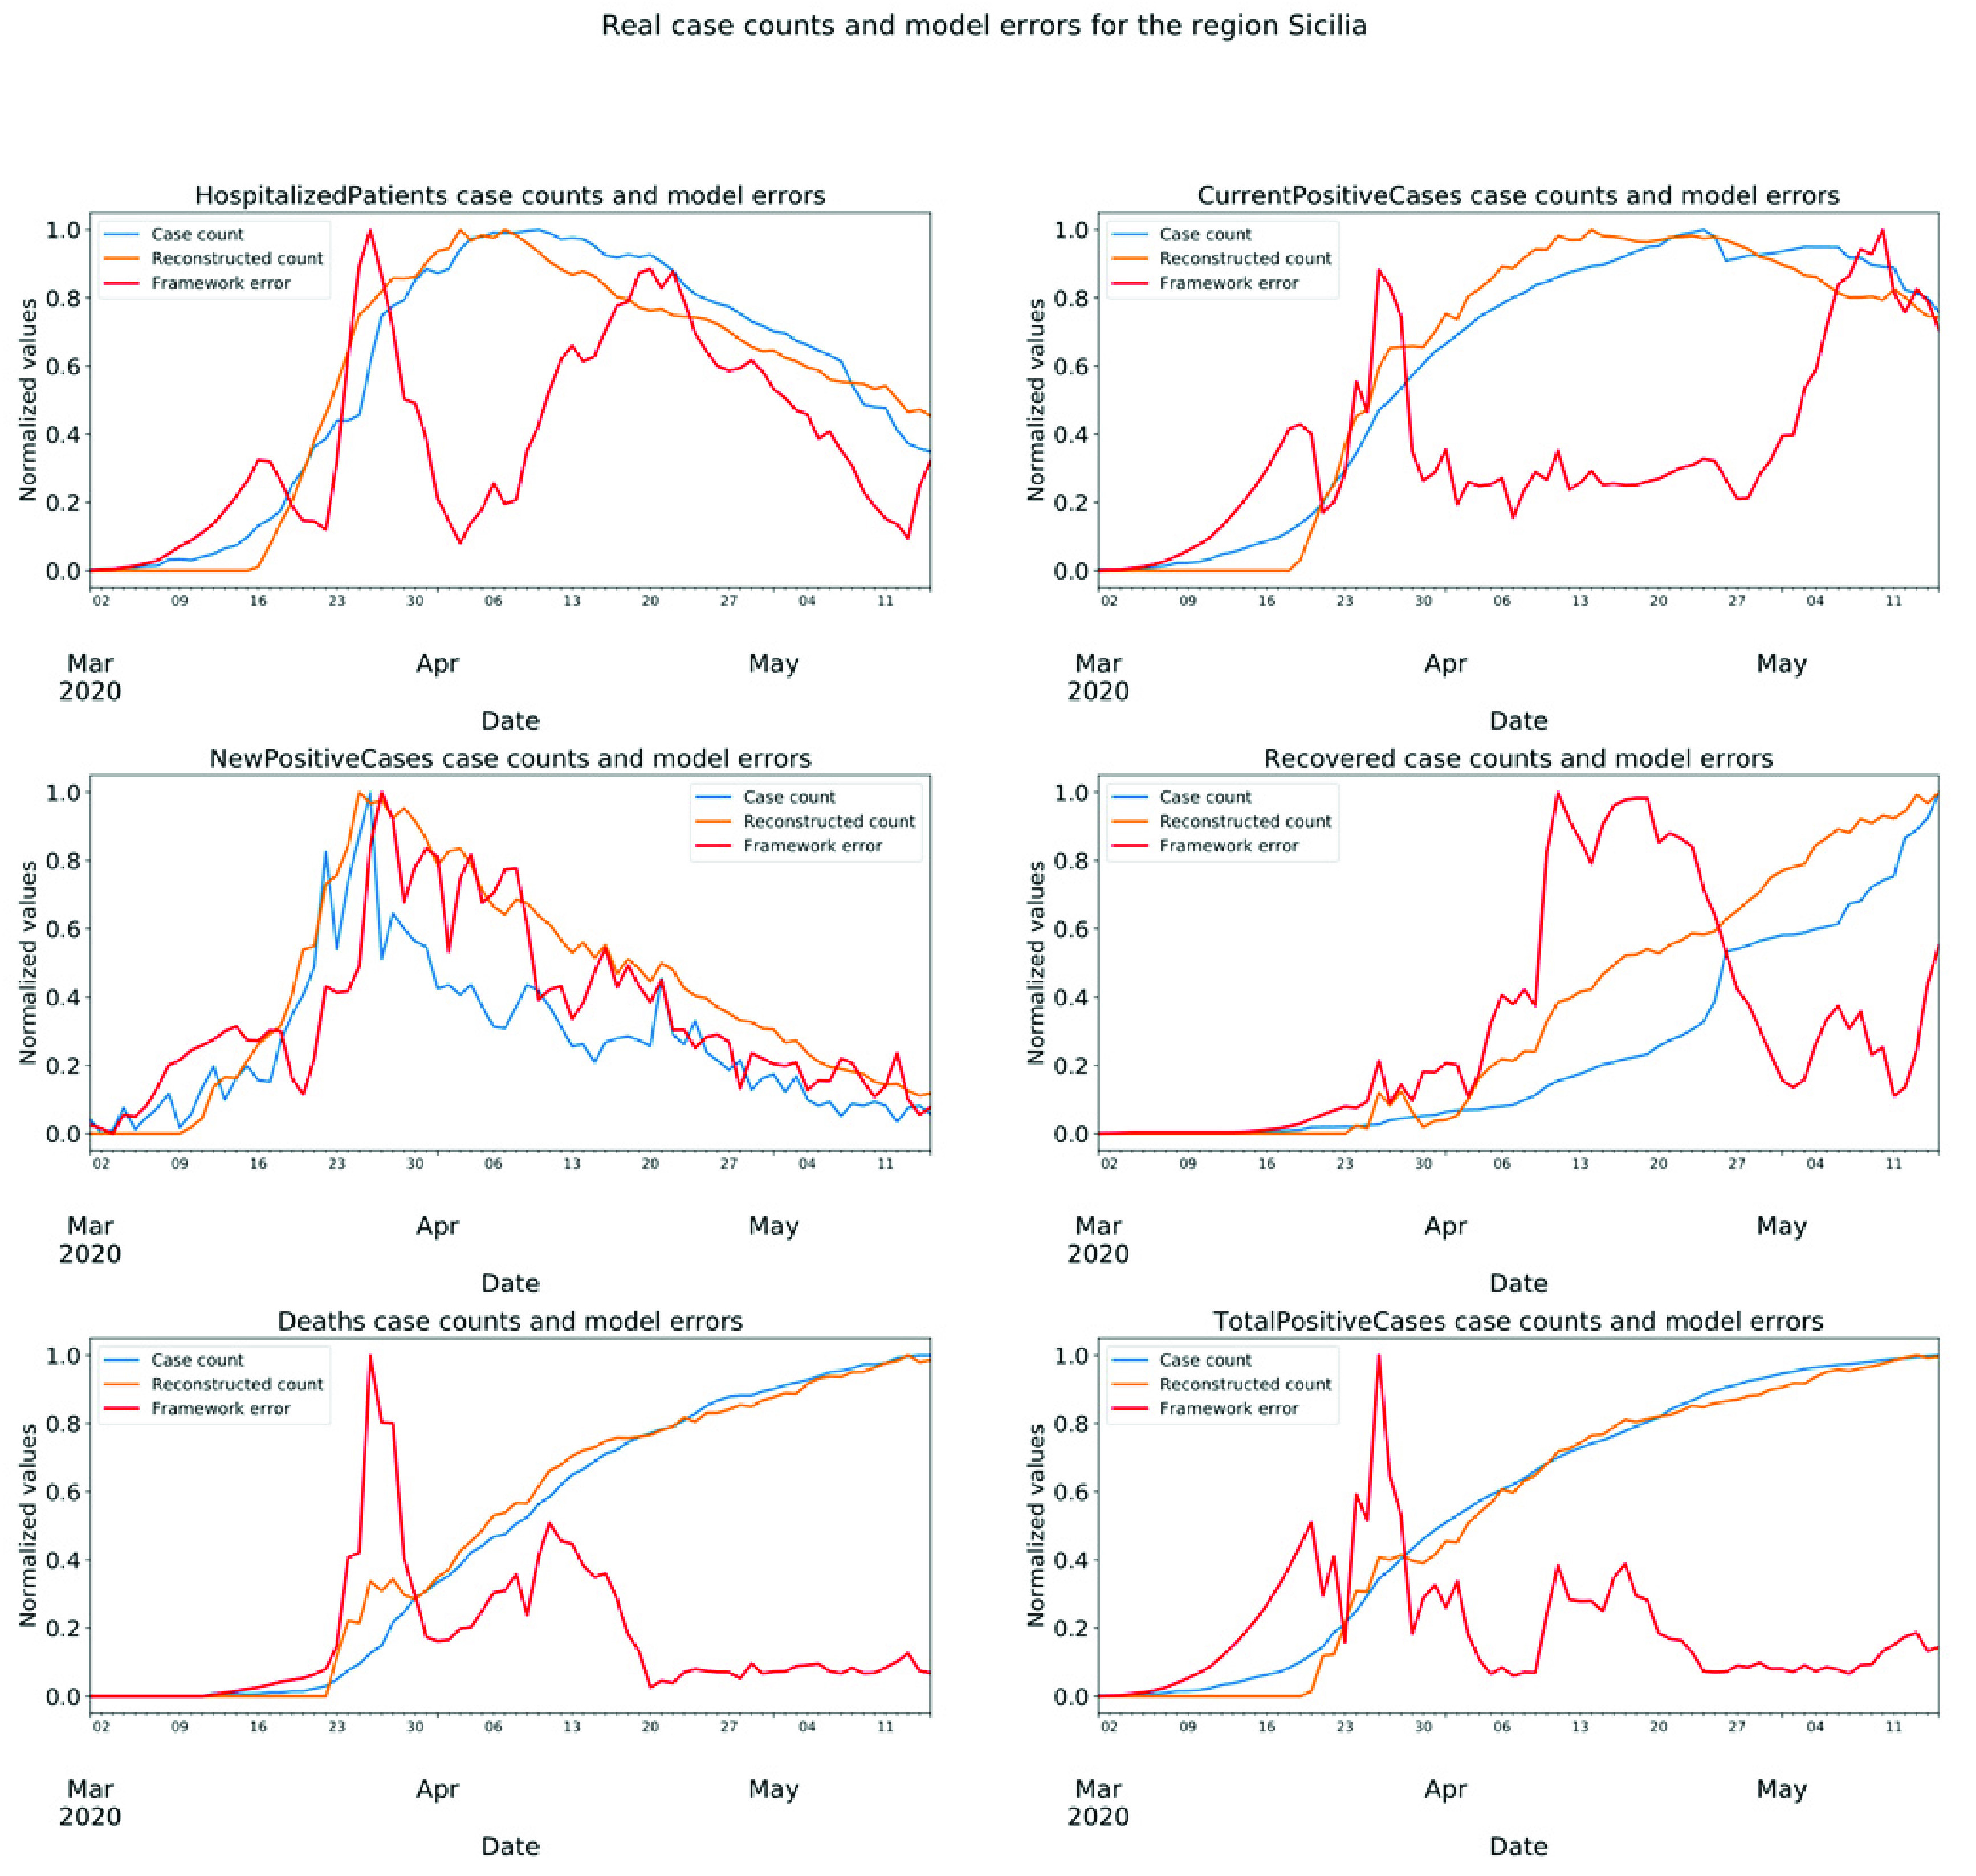
FIGURE 7.

Model test results for the region Sicilia are given for features HospitalizedPatients, CurrentPositiveCases, NewPositiveCases, Recovered cases, Death cases, and TotalPositiveCases. Real case counts are plotted in blue, reconstructed case counts are plotted in orange, and reconstruction errors are plotted in red.
