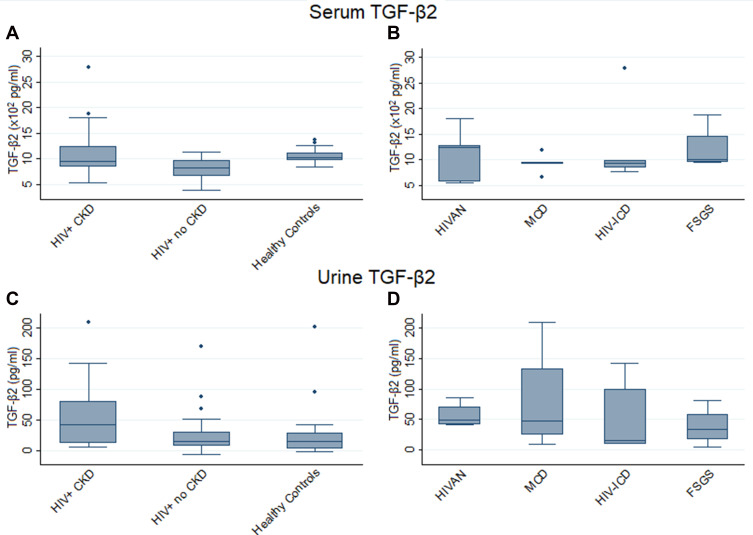
Figure 4.
Serum and urine TGF-β2 levels in HIV+ CKD patients and Controls (A and C) and HIV+ CKD histological types (B and D). Horizontal lines within each box indicate median values with the boxes extending from the 25th to the 75th percentile. Whiskers denote values within 1.5 x IQR, and dots indicate outlier values outside this range. p-values for each graph calculated comparing all participants (A and C) or all HIV-positive CKD patients (B and D) using the Kruskal–Wallis test with post-hoc analysis performed pairwise using Dunn’s Multiple Comparison Test. Significant associations: (A) HIV+ CKD vs HIV+ no-CKD p=0.008; HIV+ CKD vs healthy controls p=0.053; HIV+ no-CKD vs healthy controls p<0.001. (B) No significant associations. (C) HIV+ CKD vs HIV+ no-CKD p=0.008; HIV+ CKD vs healthy controls p=0.002. (D) No significant associations.
Abbreviations: CKD, chronic kidney disease; FSGS, Focal segmental glomerulosclerosis; HIVAN, HIV-associated nephropathy; HIV-ICD, HIV immune complex disease; IQR, Interquartile range; MCD, minimal change disease; TGF, transforming growth factor.

