. 2021 Dec 2;10:e71656. doi: 10.7554/eLife.71656

Figure 4. The C-terminal regions of DDX1, CGI-99, and FAM98B facilitate the formation of the core tRNA ligase complex.

(A–C) Truncation analysis of the core tRNA-LC (RTCB:DDX1:FAM98B:CGI-99). Pull-down assays on lysates of Sf9 cells expressing constructs of the core tRNA-LC with truncated DDX1 (A), CGI-99 (B), or FAM98B (C). The input and bound fractions were analyzed by SDS-PAGE and visualized by in-gel GFP (middle panel) or mCherry (bottom panel) fluorescence followed by Coomassie Blue staining (upper panel). (D) Top: size-exclusion chromatography purification of the minimal tRNA-LC, RTCB:DDX1(696-740):FAM98B(200-239):CGI-99(102-244). The estimated molecular weight of the peak according to its elution volume is indicated. Bottom: SDS-PAGE analysis of the final sample. The collected fractions are indicated by gray dashed lines.

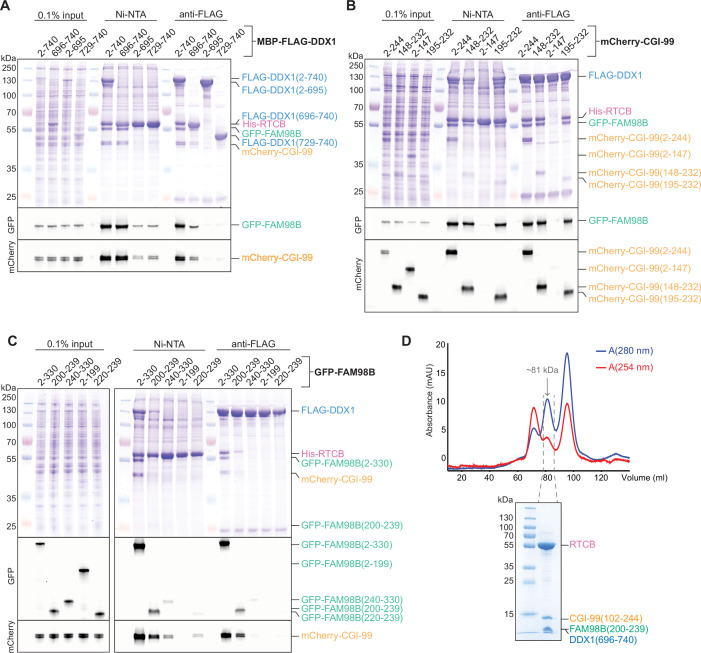
Figure 4—source data 1. Mass spectrometry analysis of protein fragments resulting from limited proteolysis of RTCB:DDX1(436-740):FAM98B:CGI-99.

Figure 4.

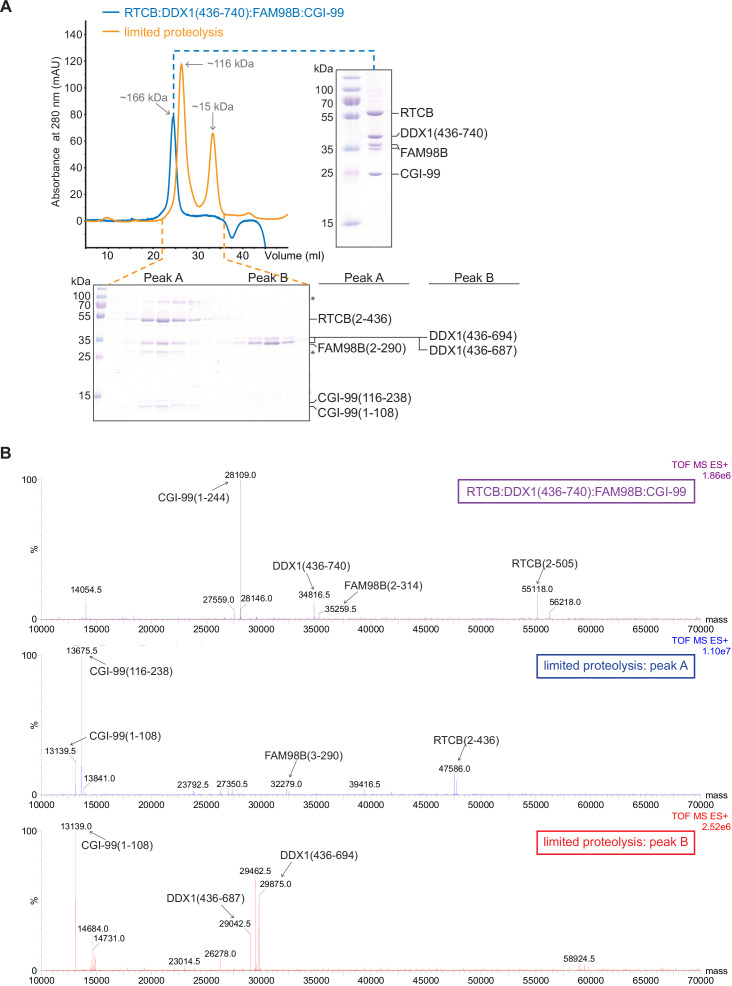
Figure 4—figure supplement 1. Mass spectrometry analysis of RTCB:DDX1(436-740):FAM98B:CGI-99 subjected to limited proteolysis.

Figure 4—figure supplement 1.

(A) Size-exclusion chromatogram of the complex before (blue) and after (orange) limited proteolysis. Elution fractions from SEC were resolved by SDS-PAGE and stained with Coomassie Blue (right and lower panels). Unidentified bands are indicated with an asterisk. (B) Masses identified by electrospray ionization mass spectrometry analysis of the RTCB:DDX1(436-740):FAM98B:CGI-99 (upper panel), peak A (middle panel) and peak B (bottom panel) from limited proteolysis of RTCB:DDX1(436-740):FAM98B:CGI-99.