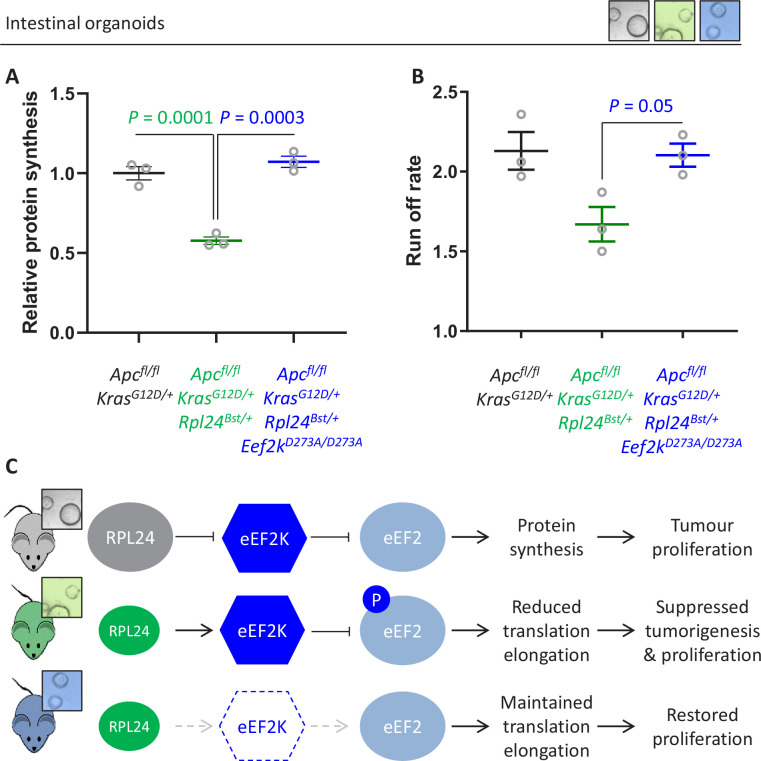
Figure 6. Genetic inactivation of Eef2k restores translation rates following Rpl24Bst mutation.
(A) 35S-methionine incorporation to determine relative protein synthesis by in Apcfl/fl KrasG12D/+ small intestinal organoids wild-type or mutant for Rpl24 or with both Rpl24 andConsistent with this, the Eef2k mutations. Data are represented ± standard error of the mean (standard error of the mean, SEM) with significance determined by one-way analysis of variance (ANOVA) with Tukey’s multiple comparison. N = 3 per genotype, each representing an independent organoid line. (B) Ribosome run-off rate determined in Apcfl/fl KrasG12D/+ small intestinal organoids mutant or wild-type for Rpl24 or with both Rpl24 and Eef2k mutations. Data are the mean of three biologically independent organoid lines represented ± SEM with significance determined by Mann–Whitney U test. Raw data are available in Figure 6—figure supplement 1A. The run-off rate for Apcfl/fl KrasG12D/+ control organoids is reproduced from Figure 3E. (C) Schematic representation of findings in Apc-deficient Kras-mutant mouse and organoid models. Top: RPL24 expression maintains translation and proliferation by suppressing the phosphorylation of eEF2 by limiting eEF2K activity. Middle: reduced expression of RPL24 activates eEF2K, increasing P-eEF2, reducing translation elongation and suppressing tumorigenesis and proliferation. Bottom: inactivation of eEF2K reverts the phenotype in Rpl24Bst cells, due to the inability to phosphorylate and suppress eEF2. Elevated elongation rates correlate with increased proliferation following inactivation of eEF2K.


