
Figure 5.
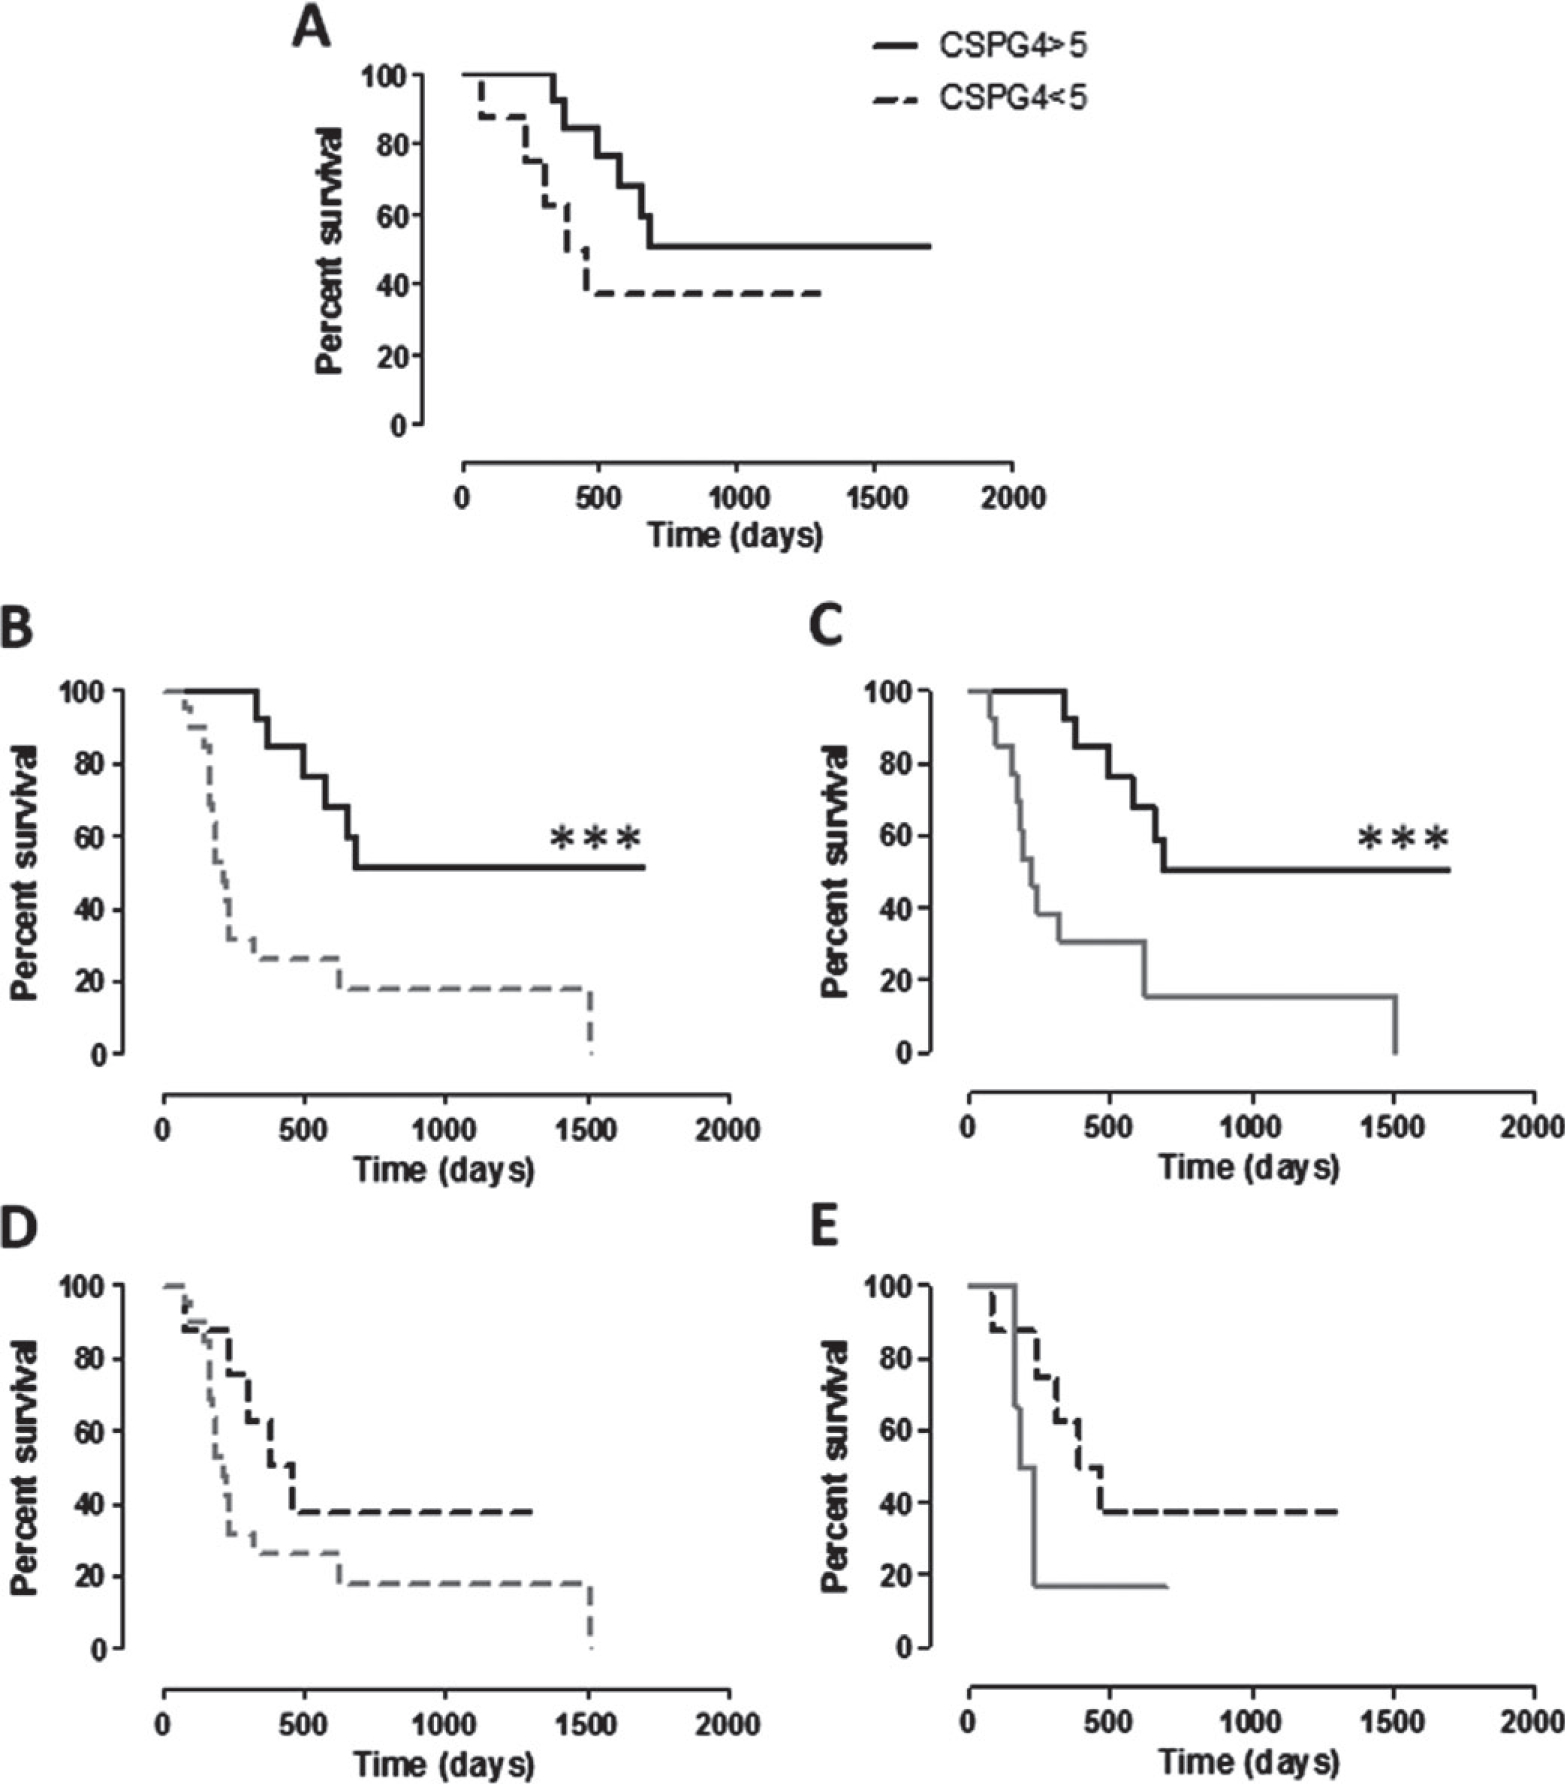
Kaplan–Meier curves comparing survival (in days) of dogs in relation to CSPG4-positivity score of cMM. (A) Survival of vaccinated dogs (group A) bearing a cMM with CSPG4-positivity score ≥5 (black line) or <5 (black dotted line). (B, C) Survival of vaccinated dogs (group A) bearing a cMM with CSPG4-positivity score ≥5 (black line) in comparison with the survival of (B) the entire population of non-vaccinated dogs (group B, grey dotted line; *** log-rank test P = 0.0004) or of (C) non-vaccinated dogs bearing a cMM with CSPG4-positivity score ≥5 (group B, grey line; *** log-rank test P = 0.0006). (D, E) Survival of vaccinated dogs (group A) bearing a cMM with CSPG4-positivity score <5 (black dotted line) in comparison with the survival of (D) the entire population of non-vaccinated dogs (group B, grey dotted line) or of (E) non-vaccinated dogs bearing a cMM with CSPG4-positivity score <5 (group B, grey line).