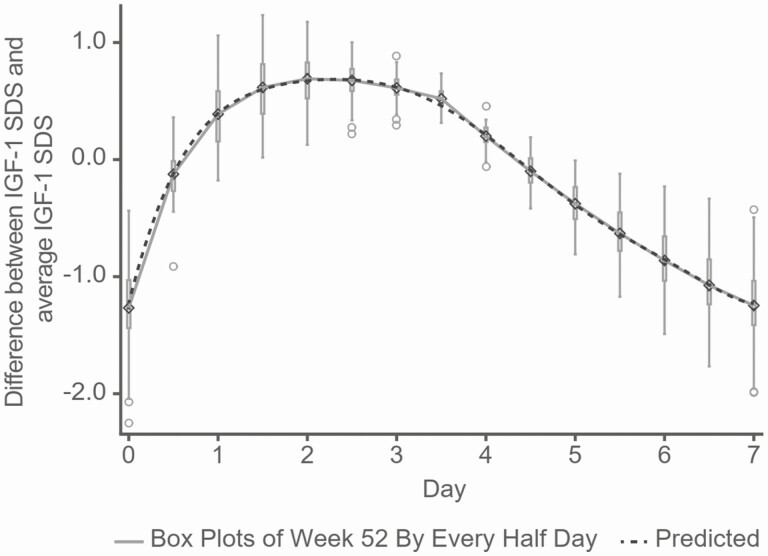
Figure 2.
Comparing Delta(d) of IGF-1 SDS from the mixed model with Taylor series, and from boxplots of simulated data from the population nonlinear model every half-day at Week 52. Simulated IGF-1 SDS values are shown as boxplots and solid line at Week 52 and the model-predicted value is shown as a dotted line. Circles: outliers of boxplots. Diamonds: simulated data from the population nonlinear model.

