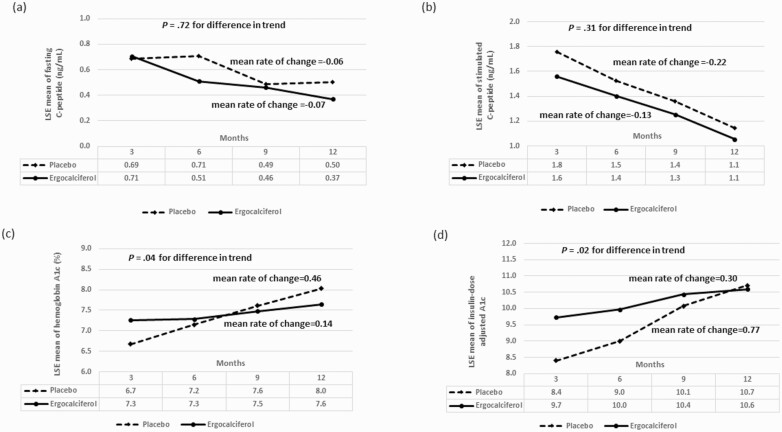
Figure 3.
A, Trend analysis of the least square estimates (LSE) of the means for fasting C-peptide showing no statistically significant difference in the changes in fasting C-peptide concentration between the ergocalciferol- and placebo-treated patients with type 1 diabetes during the 12-month trial (P = .72). B, Trend analysis of the LSEs of the means for stimulated C-peptide showing no statistically significant difference in the change in stimulated C-peptide concentration at 90 minutes between the ergocalciferol- and placebo-treated patients with type 1 diabetes during the 12-month trial (P = .31). C, LSEs of the means for glycated hemoglobin A1c (HbA1c) showing the change in HbA1c between the ergocalciferol and placebo groups during the trial. Trend analysis shows an increase in HbA1c value for the combined groups (P < .0001). There was evidence of a faster rate of increase in HbA1c in the placebo compared to the vitamin group (P = .044). D, LSEs of the means for insulin dose–adjusted A1c (IDAA1c) showing the changes in IDAA1c between the ergocalciferol and placebo groups during the trial. Trend analysis shows an increase in IDAA1c value for the combined groups (P < .0001). Though IDAA1c was statistically significantly lower in the placebo group at 3 months, it subsequently rose sharply when compared to the vitamin group (P = .015), suggesting that individuals in the placebo group had greater residual β-cell function at the beginning of the study but lost this function at a faster rate than individuals in the ergocalciferol group.

