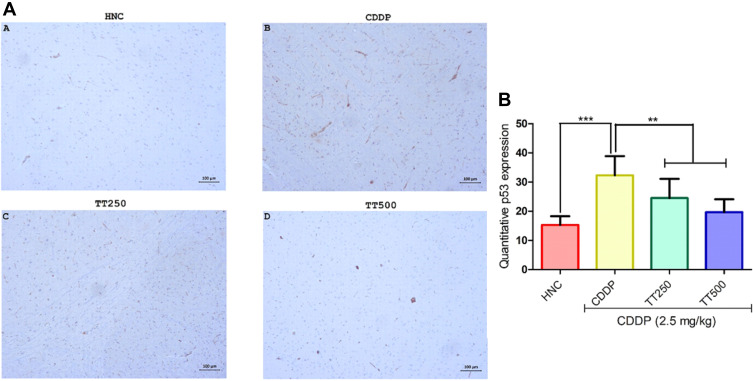
Figure 8.
Effect of TT on immunostaining intensity for p53 protein in CDDP induced neurotoxicity in rats. (A) Representative photomicrographs (×400) of p53 immunohistochemistry of rat brain, (B) Quantitative expression of p53. Results are expressed as mean ±SD (n=6) and analyzed using one-way ANOVA followed by Tukey's post hoc test. *p<0.001 indicates significant difference compared to HNC group; **p<0.001 indicates significant difference compared to CDDP group.

