
Figure 5.
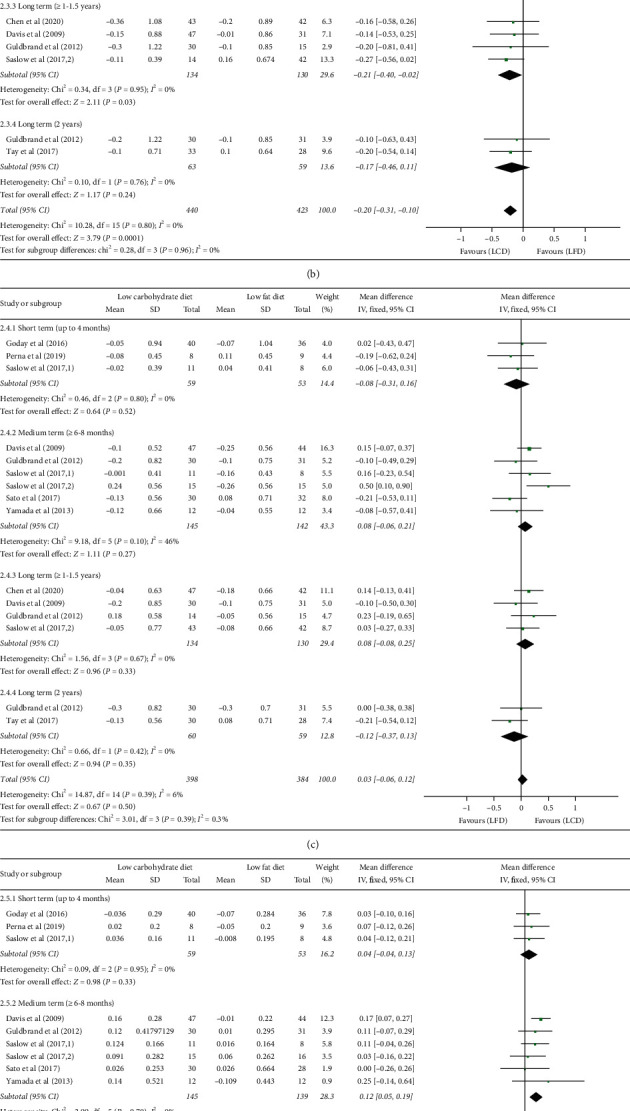
Forest plot for the effect of restriction diets on TC (a), TG (b), LDL-C (c), HDL-C (d), SBP (e), and DBP (f). TC: total cholesterol; HDL-C: high-density lipoprotein cholesterol; LDL-C: low-density lipoprotein cholesterol; TG: triglycerides; LCD: low-carbohydrate diet; LFD: low-fat diet; CI: confidence interval; SD: standard deviation.