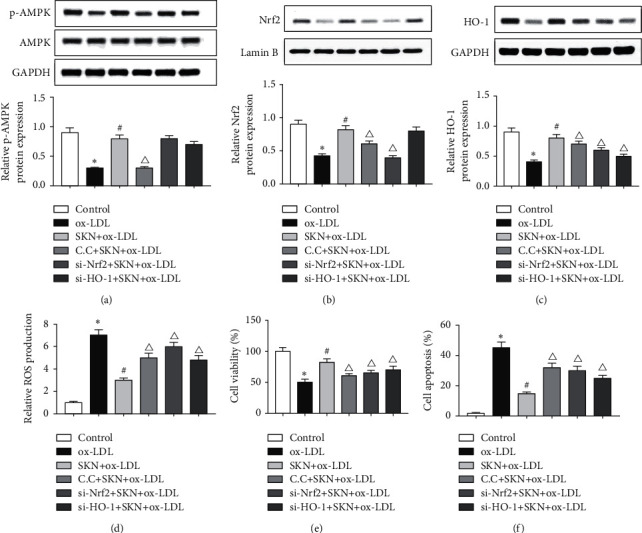
Figure 6.

Effects of SKN on AMPK-Nrf2-HO-1 signaling in ox-LDL-treated HUVECs. (a) Results of Western blot and analysis of AMPK and p-AMPK in ox-LDL-treated HUVECs. (b) Results of Western blot and analysis of Nrf2 in ox-LDL-treated HUVECs. (c) Results of Western blot and analysis of HO-1 in ox-LDL-treated HUVECs. (d) Relative ROS production of cells in different groups. (e) Cell viability in different groups. (f) Cell apoptosis rate in ox-LDL-treated HUVECs. Data are expressed as mean ± SD, n = 3. ∗P < 0.05 vs. the control group. #P < 0.05 vs. the ox-LDL group. ΔP < 0.05 vs. the SKN + ox-LDL group.
