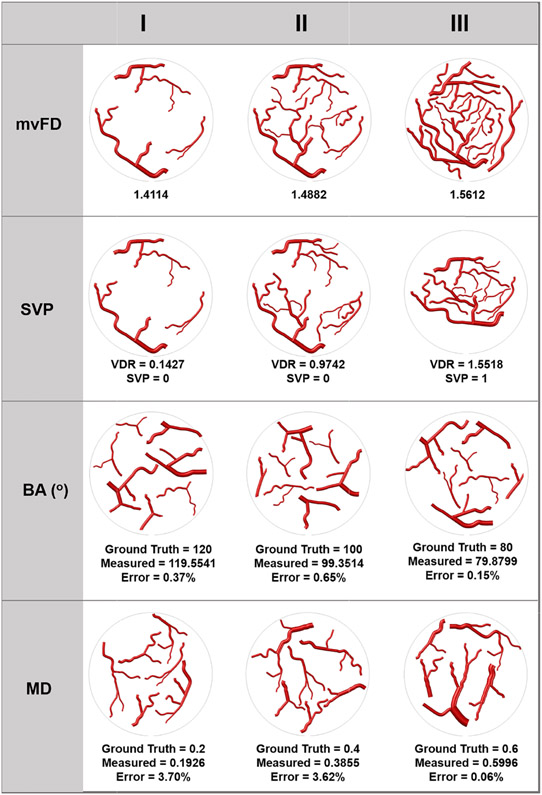
Fig. 5.
An illustration of twelve simulated small blood vessel networks for the analysis of the four new morphological parameters. First row represents different microvessels complexity in terms of fractal dimension (mvFD) with increasing complexity from column I, to Column III. Second row represents the distribution of microvessels based on spatial vascular pattern (SVP), as shown peripherally concentrated in column I and II, and centrally concentrated in Column III. Third row represents variations of bifurcation angles (BA) that decreases from Column I to II and III and the measurements are compared to the ground truth., Fourth row shows variations of Murray’s deviation (MD), where the diameter mismatch increases from columns I to II and III. The measured MD values are compared to the ground truth.

