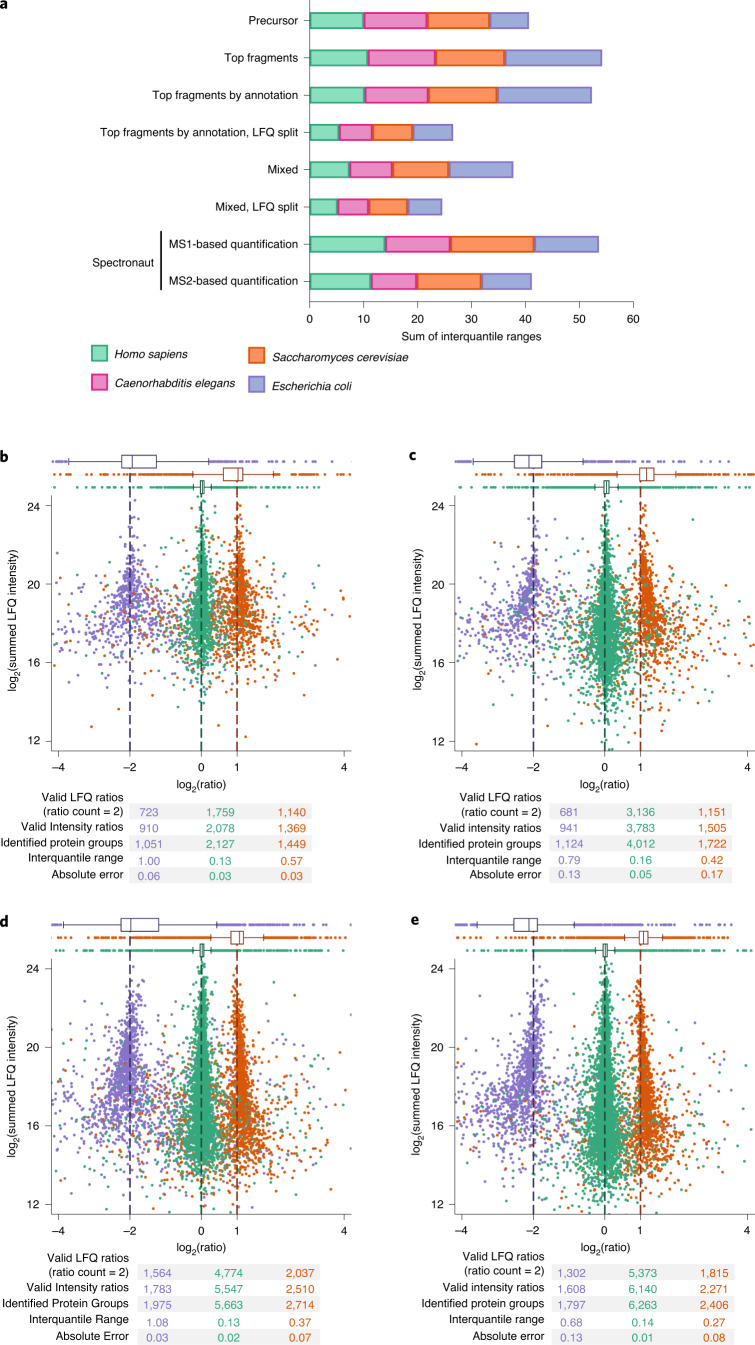
Fig. 5. MaxLFQ for DIA.
a, Stacked interquartile rages of protein ratio distributions in the small-ratio four-species dataset from Bruderer et al.34 using different versions of MaxLFQ for DIA and compared to the results from this publication. MaxDIA is capable of MS1 and MS2 level as well as hybrid quantification modes. b, Quantification of a three-species benchmark mixture measured on a SCIEX TripleTOF 6600 instrument mixing proteomes from three species in defined ratio2 with MaxLFQ for DIA. The accompanying DDA library was used. The box plots here and in the subsequent panels are based on the numbers of data points given in the tables below the respective plot (valid LFQ ratios). All box plots indicate the median and the first and third quartiles as box ends. Whiskers are positioned 1.5 box lengths away from the box ends. c, Same as b but analyzed with MaxDIA in discovery mode. d, Quantification of a three-species benchmark mixture measured on a Bruker timsTOF Pro instrument mixing proteomes from three species in defined ratio using a DDA library. e, Same as d but analyzed in discovery mode.

