FIGURE 1.

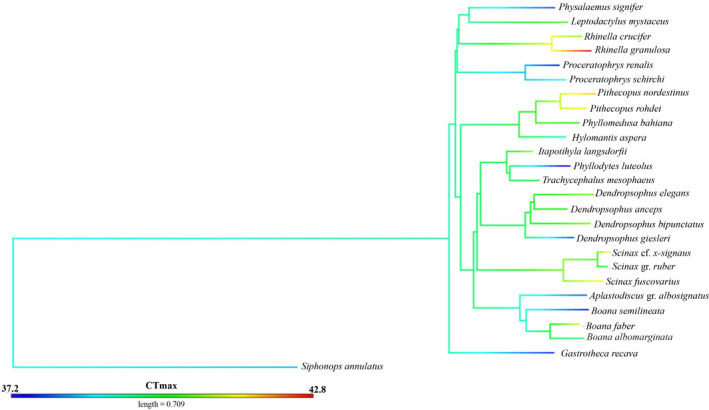
Phylogenetic tree including the 26 species studied (sensu Pyron & Wiens, 2011). Branch colors denote critical thermal maximum values for species. Color's gradient reaching from blue (lower CTMax) to red (higher CTMax)

Phylogenetic tree including the 26 species studied (sensu Pyron & Wiens, 2011). Branch colors denote critical thermal maximum values for species. Color's gradient reaching from blue (lower CTMax) to red (higher CTMax)