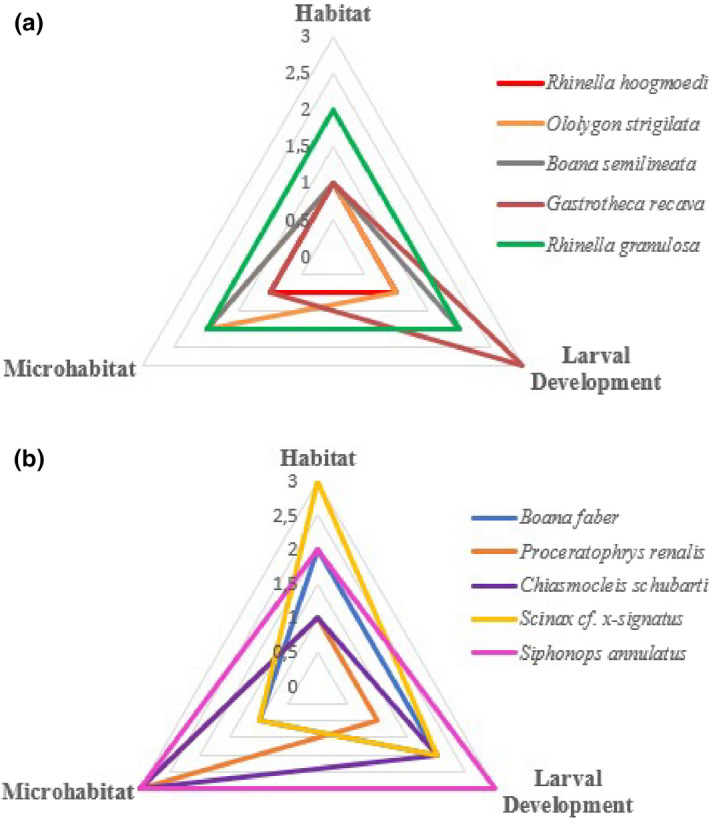
FIGURE 2.

Radar charts showing ten patterns found for vulnerability according to ecological variables of macrohabitat, microhabitat, and larval development site. Each chart (a and b) is composed by five representative species for the general ecological patterns studied in the current study. Ecological categories were classified (1, 2, or 3) by CTMax (ºC) values (1—less tolerant species; 3—more tolerant species) according to the results of ecological covariates in the group analyses. Charts with smaller areas denote greater thermal vulnerability than those with larger areas
