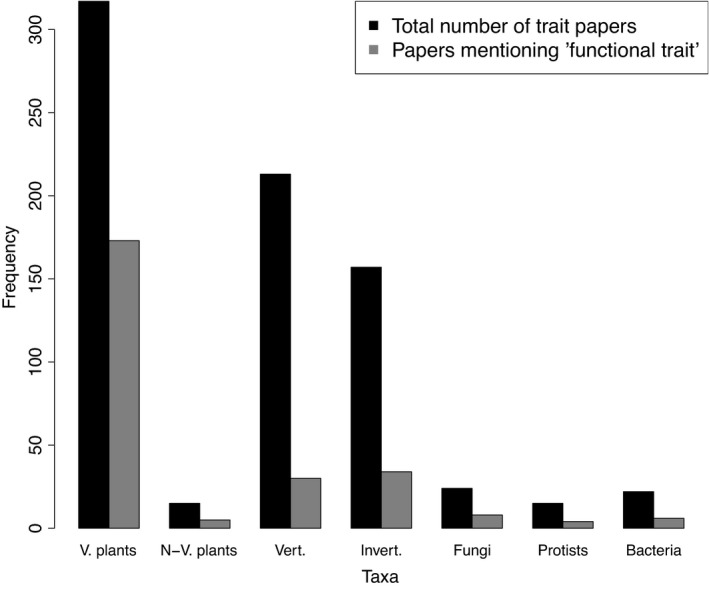
FIGURE 3.

Number of papers out of a total 712 that focus on different taxa (black bars) from the trait literature published in 2018 in 18 selected journals. Frequencies for archaea (2 papers) and viruses (1 paper) are not shown. Papers that include the term “functional trait” in the text are shown in grey bars. Abbreviations: V. plants = vascular plant, N‐V.plants = nonvascular plants, Vert. = vertebrates, Invert. = invertebrates
