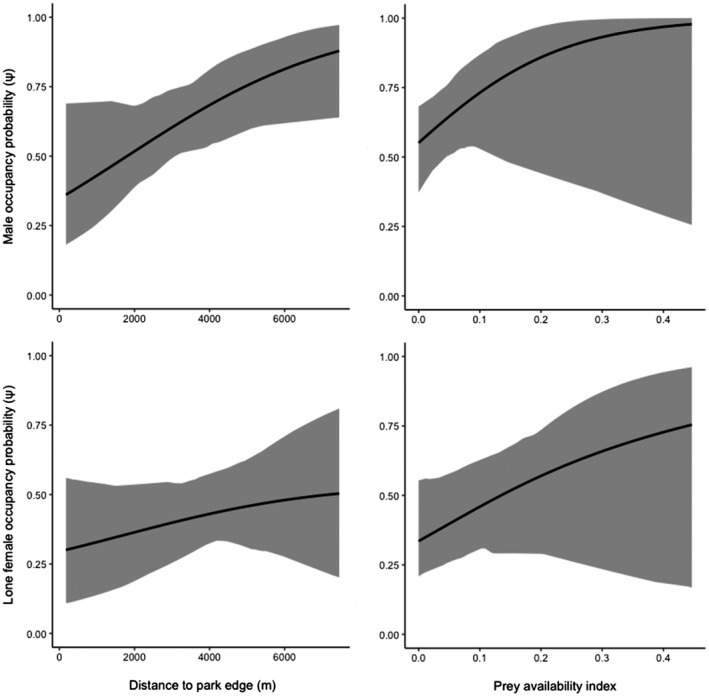
FIGURE 4.

Plotted model‐averaged marginal occupancy probabilities (occupancy without taking into account species interactions) of male leopards and lone female leopards as a function of distance to the edge of Tandoureh National Park (column 1) and prey availability (column 2), with values for other environmental covariates held constant. Gray ribbons indicate 95% confidence intervals. Due to the very large confidence intervals for family occupancy, marginal occupancy plots for leopard families were excluded
