FIGURE 2.

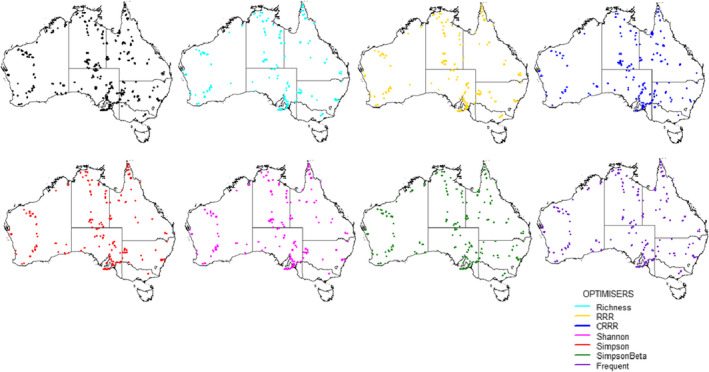
Geographic location of the selected plots (N = 250) applying the maximum coverage problem. Black dots correspond to all the plots established. Color dots refer to each of the selection employing different optimizers

Geographic location of the selected plots (N = 250) applying the maximum coverage problem. Black dots correspond to all the plots established. Color dots refer to each of the selection employing different optimizers