FIGURE 3.

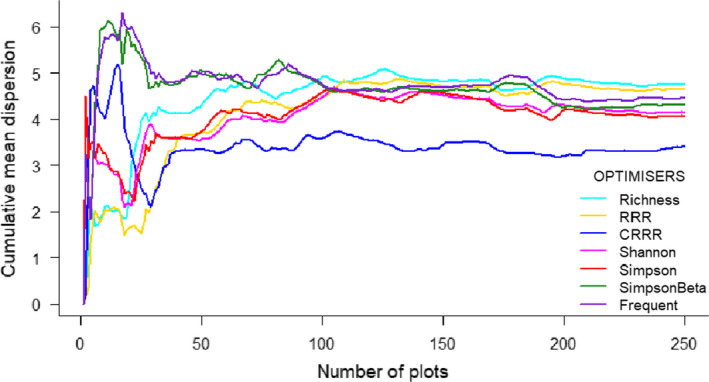
Environmental representativeness of the 250 selected plots using different optimizers reflected by the cumulative mean dispersion. All environmental variables employed in the analyses are described in the Appendix S4

Environmental representativeness of the 250 selected plots using different optimizers reflected by the cumulative mean dispersion. All environmental variables employed in the analyses are described in the Appendix S4