
FIGURE 3.
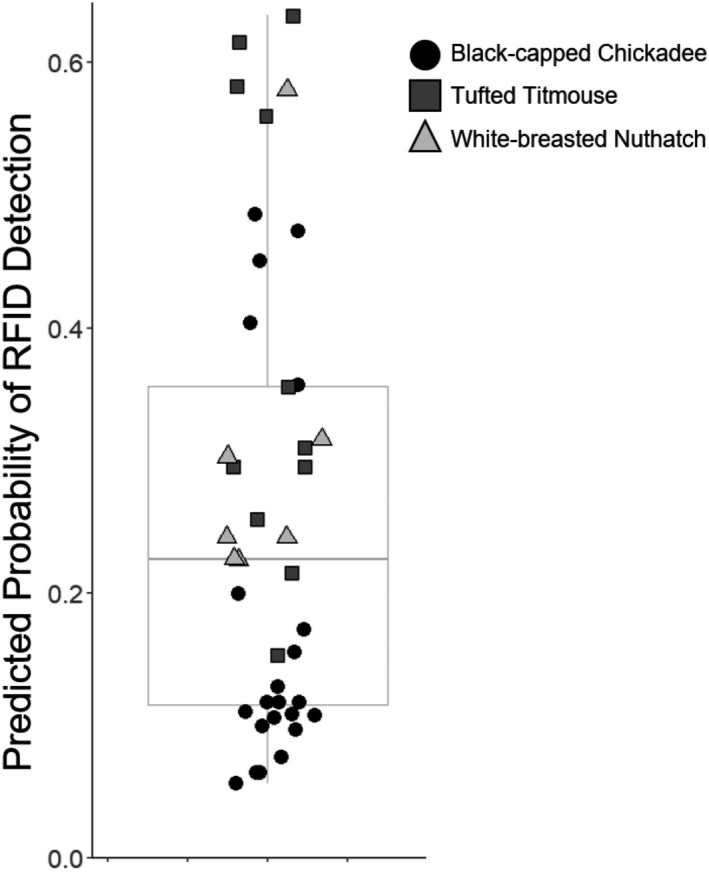
The estimated probability of radio‐frequency identification (RFID) detection varied among individual birds. Each point represents the estimated probability of an individual's visit being detected, holding constant all fixed effects (visit length =1.87 s, site =2) except for species; the estimated probabilities were calculated for the species that was associated with each RFID tag. The species of each point is referenced by color and shape (black circle = black‐capped chickadee, dark gray square = tufted titmouse, and light gray triangle = white‐breasted nuthatch). Symbols are spread across the horizontal axis to reduce overlap and improve legibility